|
Basic Assignments
|
Options & Settings
|
Main Time Information
|
||||||||||||||||||||||||||||
|
|
|
|
|
||||||
|
||||||
|
|
|
Notes:
|
|
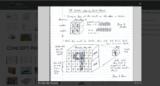
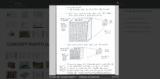
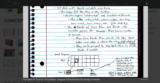
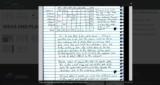
Briefly talking with Russell and Steve about 3D data tables and reports. We would love to offer different views, sums, totals, graphs, etc. We would love to create a virtual dashboard that looks cool and provides a great look at what we have stored and even what it means. We popped into some older drawings from the developer's notebook and looked at concepts for 3D calendars (virtual drawers broken down into months, weeks, days, hours, minutes, etc.), displays based off of categories and totals, and other report views. Later in the session, I went back and spent some time and did some review of the drawings and concepts that we are trying to bring together. I would really like to get back to some of those pieces. See the photo gallery for some screen shots. If you need more, go to the photo gallery - online developer's photo gallery |