|
Basic Assignments
|
Options & Settings
|
Main Time Information
|
||||||||||||||||||||||||||||
|
|
|
|
|
|||
|
|||
|
|
|
Notes:
|
|
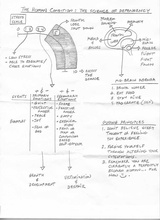
Good work session with Shannon. We started out talking about stress and how that effects the brain. See attached for a copy of some notes from a guy by the name of Paul Finnlay (spelling?). He was teaching a class yesterday at church about mental health and coping skills. We were talking about how if your stress levels get too high, your entire frontal lobe of your brain shuts down. You end up falling back into the mid-brain (animal) type behaviors. Anyways, some fun conversations. We then jumped into working on some new content for the level 4 BI - business intelligence level of the value add-on core model. Most of the session was me showing Shannon why we need this and where normal transactional data starts breaking down. I did a lot of drawing and showing her what we currently have and where it could go. I was having tons of fun and we had some great talks. Here are some of my notes: - Looking under the covers... how many database queries it really takes to show the correct transactional data with all of it's relationships and one-to-many parts and pieces. - What does it take to extract that data? What do we do with it to transform it into something usable? How and where do we store the new transformed information? - How much value BI (business intelligence) is worth. For example: Say you have a company that is using a number of different products to run their entire business. They have data all over the place, in multiple different systems. Say that same company employees 20 people to pull all of the data together and build spreadsheets to show the company financials. These numbers are from a real company, just using them for fun. Say you take 20 people and pay them at least $5,000 a month. That's $100,000 a month. You then take that number times 12 months for a single year. That is $1.2 million, just for your data extract and transform people who are doing your spreadsheets. What would that BI be worth if it was in a single place (adilas database) and you could search and query it as needed vs going to tons of different spreadsheets? It would be worth a ton... :) - Dealing with the value of BI - people already pay for this - business consulting and data analytics - they go through very painful steps and processes to get it - we could help there. - Clients want BI stuff - what changes would we need to make and build to get there - fully? - There are so many things going on... sometimes it feels like the dream is getting lost - we are focusing on surviving vs inventing and thriving. - What excuses am I leaning on? Ask yourself that question. - From Disney/Pixar's "A Bug's Life" - The ant "Flik" was an inventor. The other ants just wanted him to help gather food like normal. He kept trying to help. That was both good and bad. Eventually, some of his inventions helped to make things better. Invention can be good! Sometimes it takes a while. - There is a constant flow between chaos and order - how maintenance plays into this mix - back to talking about stress levels and going into survival modes. |