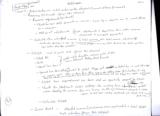
all data is live and searchable
|
Basic Assignments
|
Options & Settings
|
Main Time Information
|
||||||||||||||||||||||
|
|
|
|
|
|||||||||
|
|||||||||
|
|
|
Notes:
|
|
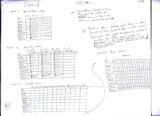
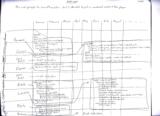
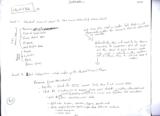
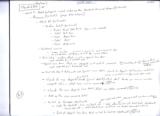
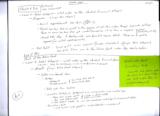
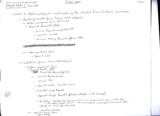
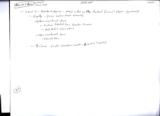
Freepaper Brainstorming - Time, Objects & Data, P&L, & Balance Sheet Spanning from January 28-31 2011 Time, Objects, & Data Brainstorming – Spanning from 1/28/11 – 1/31/11 (Page 1 – Front) Level 1: year_to_date values From 1 to … - Rev - COGS - Gross - Expense - Net - Assets - Liabilities - Equity - Balance Level 2: quarterly values 1st Qtr. (Jan-Mar), 2nd Qtr. (Apr-Jun), 3rd Qtr. (Jul-Sep), 4th Qtr. (Oct-Dec) - Rev - COGS - Gross - Expense - Net - Assets - Liabilities - Equity - Balance Level 3: monthly values January to December - Rev - COGS - Gross - Expense - Net - Assets - Liabilities - Equity - Balance Level 4: daily values I.e. January 1-31, etc. - Rev - COGS - Gross - Expense - Net - Assets - Liabilities - Equity - Balance Everything is based on time. The corp-wide setting for fiscal year will play in to determine year, quarter, and months. Just an idea… maybe put time on down (rows) and the objects and data on the across (columns). This might be easier for printing and scrolling… Then again maybe not… (It depends on if the objects and data are in simple form or expanded into details. If details, it could get pretty hard to read.) (Page 1 – Back) This was going to be something else… but I decided to put a condensed version of the players. - Revenue: o Stock #’s o Parts o Special line items o Non invoice revenue from normal deposits o Other revenue from deposits o Calc revenue o Figure adjustments (trade & deposit revenue adjustments & negative invoice bad debt payments) o Calc adjusted revenue - COGS: o Stock #’s (special 3-way switch to help determine COGS on stock/units) • 1= base price & internal parts & outside repairs, • 2= full stock/unit basis including adjustments & interest, & • 3= base price only. o Parts o Special line items o Special line items (as a negative – corp-wide setting) o COGS from expense/receipt line items - Gross profit: o Simple calculation - Expenses: o Expense/receipt line items (normal) o Special line items (as a negative – corp-wide setting) - Net profit: o Simple calculation - Assets: o System-maintained items • Bank(s) • Petty cash from location(s) • Inventory – stock/units • Subs & inventory types • Inventory – parts • Accounts Receivable (A/R) I. Invoice payments not yet deposited II. Amounts owed on transition invoices III. Invoices missing payments (normal A/R’s) o User-maintained items • Items & subs - Liabilities: o System-maintained items • Accounts Payable (A/P) • Owed on accounts (splits) • Owed reimbursements • Owed on PO’s • Payments made on transition invoices • Submitted check requests • Approved check requests already reflected in bank balances • Inventory – stock/units • Owed on units that are sold • Owed on floorplan o User-maintained items • Item & subs - Equity: o System-maintained items • Future potential from transition invoices • Net profit (from P&L) o User-maintained items • Items & subs - Balance: o Simple calculation (Page 2) Level 1: Standard Financial players for P&L (income statement) & balance sheet - P&L Income Statement o Revenue o Cost of Goods Sold o Gross Profit (calc) o Expense o Net Profit (calc) - Balance Sheet o Assets o Liabilities o Equity o Balance (calc) We may also need a master list that is not dynamically hidden for training & showing options that are available. Automatically, this will need to be dynamic according to corporation. Not all corps are the same & each business needs only what is actually in the system. If it is there, show it. If not, keep it hidden. Level 2: Detail Categories – what makes up the Standard Financial Players Revenue (major P&L category) - Prep step – check for QTI invoices (only done if not current date) - Stock #’s (anything prior to 9/30/07 – check actual stock #’s – anything after that use invoices) (Anything new (corps) will be on invoices even if date is before date submitted). o Grab #’s & $’s from allinv_final_numbers table o Split into trailers, vehicles, toppers, specific units o Each section (inventory types) make the following containers • Total base price. • Total basis (Page 3) Objects & Data continued Level 2: Detail Categories – what makes up the standard financial players (Continued) Revenue (continued) – (Major P&L category) - Stock #’s (continued) o Section totals (continued) • Total Final Sale Price (tax is not included) • Total Part Sum • Total Repair Sum • Total ACV • Total Allowance - Internal invoices o 3-way switch – 0 = normal, 1 = special loc specific look-up, 2 = skip o No real #’s here – just helping to build the connect filters - Part sales – anything that is not a special line item o Grab extended price & extended cost - Special line items that are assigned a roll call of revenue (part_handling - id=14) This is done through corp-wide settings. o Grab extended price & extended cost - Small side step if dealing with cash (verified invoice date). Check for deposits that have been verified but missing a verified invoice. (Somewhat older code) - Check for any deposits (line items) made (normal deposits) that don’t have an invoice number assigned. This is called “non-invoice revenue”. (category type = 10) - Check for any deposit line items that are “other revenue”. (category type = 7) - Add up the main revenue total - Switch to revenue adjustments o Check for stock #’s. Sum up (total acv – total allowance) to get total trade adjustments (ACV = actual cash value) (allowance – what was shown as a trade-in price). • Small side note… each stock/unit could have 1-4 trades associated with it. o Grab all deposit line items that are tied to “revenue adjustments”. (category type = 11) (Page 4) Objects & Data continued Level 2: Detail Categories – what makes up the standard financial players (Continued) Revenue (continued) – (Major P&L category) - Revenue adjustments (continued) o Check for bad debt payments on invoices. Times by a negative one to invert these to a negative. o Add up all adjustments (trade adjustments & deposit line items under revenue adjustments and bad debt payments) - Calculate the adjusted revenue (total revenue +/- total revenue adjustments). o Small note: the reason it says +/- is because there is some logic that looks at the totals and their signs before doing the calculations. - COGS – Cost of Goods Sold – (Major P&L category) o Stock #’s – pulled while doing the revenue portion of the income statement. Pretty straight forward. o Parts – pulled while doing the revenue portion of the income statement. Pretty straight forward. o Special line items – pulled while doing the revenue portion of the income statement. Pretty straight forward. o Special line items that are pointed to COGS. These get multiplied by -1 and show up as negative COGS. This is done from the corp-wide setting page. (part_handling_id = 15). These are actually invoice line items that don’t get counted as revenue but are flipped to a negative cost of goods sold. o COGS from expense/receipt line items that are specifically assigned to COGS. o Check for stock/unit COGS settings. The numbers have already been pulled when checking for revenue. This is a 3-way switch. (1 = base price + internal parts + outside repairs, 2 = full basis including adjustments and interest, & 3 = base price only) o Calculate COGS - Gross Profit = Adjusted revenue (normal revenue minus adjustments) – total COGS simple calculation - (Major P&L Category) (Page 5) P&L & Balance Sheet continued Level 2: Detail Categories – what makes up the standard financial players (Continued) - Expenses – (Major P&L Category) o Normal expense/receipt line items (category type = 9) o Special line items that are pointed to the expense roll call. This is done through corp-wide settings. These are invoice line items that get inverted (multiplied by -1) to show a negative expense. o Small side step if dealing with cash (verified expense dates). These are for pending expenses (non-verified expense payments) - Net Profit – Gross profit minus expenses. (Simple calculation) – (Major P&L Category). o Net profit flows over to the balance sheet under the equity section. End of P&L Start of the Balance Sheet Level 2: Detail Categories – what makes up the standard financial players – (prep step – check for QTI (transition invoices) invoices, line items, & payments) - Assets – (Major Balance Sheet Category) o System-maintained items • Bank(s) I. All deposits - (from bank start date to balance sheet date) II. All E/R payments- (from bank start date to balance sheet date) • Petty cash from locations • Inventory – stock/units (consignment & non consignment) – cash inventory type I. Repair subs (outside repairs) – include or don’t include, passed in as an option II. Part subs (internal parts) – include or don’t include, passed in as an option III. This section creates its own subs according to inventory type and consignment and status. • Inventory – Parts I. Cost switch maybe passed in, 1 = actual (default) or 0 = average cost II. Small note about inventory – Parts – currently the query pulls all active line items and does not limit and/or filter by active/inactive parts (Page 6) Balance Sheet continued Level 2: Detail Categories – what makes up the standard financial players (continued) - Assets (continued) – (Major Balance Sheet category) o System-maintained items (continued) • Accounts Receivable (A/R) I. Invoice payments not yet deposited II. Transition invoices III. Invoices missing payments (normal A/R’s) o User-maintained Items • Items & subs - Liabilities – (Major Balance Sheet category) o System-maintained items • Accounts Payable (A/P) I. Owed on account (splits) II. Owed reimbursements III. Owed PO’s IV. Payments made on transition invoices V. Submitted check requests VI. Approved check requests (already reflected in bank balance(s)) VII. Inventory – stock/units (consignment & non-consignment_ each inventory type o This section creates its own subs according to inventory type and consignment status VIII. Owed on units that are sold IX. Owed on floorplan o User-maintained items • Items & subs (Page 7) Level 2: Detail Categories: What makes up the standard financial players (continued) - Equity – (major balance sheet category) o System-maintained items • Future potential from transition invoices • Net profit (from P&L) o User-maintained items • Items & subs - Balance – simple calculation (assets = liabilities + equity) |