all data is live and searchable
|
Basic Assignments
|
Options & Settings
|
Main Time Information
|
||||||||||||||||||||||
|
|
|
|
|
|||||||||||||||
|
Photo/Image Count: 14
|
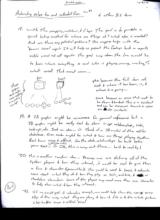
|||||||||||||||
|
|||||||||||||||
|
|


|
Notes:
|
|
Automating Sales Tax and Collected Fees & Other B.S. Items: Questions and concerns: 1. How do I name the output on the balance sheet? How do people want to see it? - Taxes? i. State, county, city, 5 dynamic, out of area, could be 0, 1, 2+ (or infinity) - Collected items? i. Could be 0, 1, 5+ (five is a random # but it could be infinity) 2. With only one location, the scenario above is workable. What would happen if you had 10, 20, 100+ locations? 3. Because it is so dynamic (0 to 100+ it seems to me that we need a 1-many on a per corp or per location level. Just an idea, we may want to start one by default that is only half setup so that is automatically tracks sales tax. On all of the drill-downs, put notes how to complete the process… 4. At one point we were talking about a hybrid balance sheet item…. How might this play in to the mix? I know that I need some sort of item to link up everything on taxes and collected items. What other pieces of the puzzle need help? 5. What if we made some modifications to all existing user-maintained balance sheet items and allowed for them to be hooked-up just like we need for taxed and collected. Hooked-up might mean… where or what are my incoming values, where or what are my outgoing values, and do I need any extra entries (general pointers, declarations, hybrid pieces, special bridges, pads, gaps, extensions, connections, hand holding, filling, extra entries, etc.)? This hook-up would not be required for the items to function. 6. So, what this could mean is that a user-maintained balance sheet item could be a standalone item (no watchers or no extra helpers) and it could functions “as is” right now. This is fully user-maintained and a manual process. However, if you add 1 or more watchers (and/or helper, feeders, participants, extra players) it could become some sort of hybrid. This might help with a known gap between B.S. expense types and B.S. deposit types. This could be cool because some B.S. items only need to watch one thing (an in or out). However an item could be setup to watch for ins, outs, and extra declarations or standalone entries. 7. As long as I’m brainstorming… what about a thing we wanted to call “special callouts” or “accrual callouts”. These are system-maintained items that need to be able to standalone. Say a special A/P for a certain vendor or a certain A/R for a specific customer that you do a lot of business with. These are basically handled just like the other A/R’s (invoice & payments) and other A/P’s (PO’s & payments or e/r’s & payments) but they are not lumped into the group as a whole. Basically, we set a watcher, as alias name, and a grouping for either a vendor or customer. The system runs all the logic and math but the end result is a standalone callout or hybrid system-maintained B.S. item. 8. This might also be a great time to set up a 1-many from vendor to expense type (defaults per vendor). 9. If we do allow hybrid user-maintained and hybrid system-maintained items, what would we call them or is “hybrid” a good word? Maybe two corp-wide settings? 10. A hybrid system-maintained item would be a special callout and would require a name, grouping, and either a vendor id or customer id. If a vendor was chosen, it might need checkboxes for e/r’s and po’s (or select both at the same time). 11. A hybrid user-maintained item would need a host (main) user-maintained balance sheet item. Which has the name, grouping, and math instructions. It also has options to hold subs. It then could have a B.S. deposit type watcher, a B.S. expense type watcher, multi B.S. deposit or expense type watchers (1-many if needed), standalone declarations, or known system feeds or feeders. 12. Just as an idea… a “standalone declaration” would be a generic non-specific item that could cross boundaries and be pointed to I.S. revenue, I.S. cost of goods sold, I.S. expenses, B.S. assets, B.S. liabilities, and B.S. equity. This could definitely get abused and has no backing. The name standalone declarations. On purpose, I may want to make it standout like a sore thumb so that it doesn’t get out of hand. There are reasons for it but it should be the exception not the rule. This is the item that can make the dreaded word “adjustments”. 13. A “system feed” is a certain section, part #, or known area of the system. The reason it would be called a system feed is because no manual entries are made but they are looked up (hence dynamic) from another known part of the system. A good example is sales tax, we know where it lives and should be recorded as a sum per day instead of individual details. The cool thing is one more drill-down and you could be at the detail level. Another good example is part # “collected”. It is assigned on an invoice line item and may need to be further categorized or filtered by description. 14. Histories on the standalone declarations will be very important. They will have their own homepage that can be accessed directly and from the P&L homepage and the balance sheet homepage. 15. After talking to Steve about this idea of standalone declarations, he thought that it might be a good idea to have a tool to link declarations together. For example: say that you are moving something from one account to another, you may want both actions to be linked together. This is not required but may be handy. 16. Before we go automating everything… what about documenting or mapping all system-maintained items out on paper. It might be good to take a small side step and map all of the know flow and what flags are needed to speed up the process. This could also help identify additional holes. 17. If we create a map, maybe we should go back to the underlying logic (where the add/edit and view takes place) and help the system keep track of known issues, dates, date ranges (windows), etc. It would be so nice to be able to search flags and dates instead of the main items, then the line items, and then the payments (sub loops and sub payments). Some of the flags that would help are: (not a full list) - Start, end, pre-main, pending, post or after main, paid, voided, match, complete, verified, posted, reconciled, transition period, etc. - Think of all the options for each piece. What are the possible states and status, both required (solid line) and optional (dotted line)? B.S. and I.S. flags? Basic and advanced? 18. With the mapping, watchers, and flags. The goal is to provide a quick look-up method for where are things at? What else is needed? And are there any potential problems? This mapping helps with the “known issues” report. It will help us present the findings back in reports and/or visual roll call reports. The goal way down the line would be to know where everything is and who is playing, moving, waiting, and in what area? Think overall vision…. - This becomes the full item roll call and where it has been, is, and where it is going… - Time becomes an issue that need to be shown and tracked. This is a constant and can be measured. Amounts and values are also constants. - These graphics don’t really mean anything it is just a concept - (See scan in photo gallery for graphics) 19. A 2D graphic might be awesome for general reference but a 3D graphic might be really cool to show 1-many relationships, subs, look-ups, etc. Just an idea… Think of a 3D model of the adilas database. Even cooler might be what and how are things playing together. Real time cause and effect. See the data relationships be built before your eyes… (interactive model) Okay, this is way out there… back to reality! 20. This is another random idea… Because we are defining all of the system players and how they interact, it would be cool to give them a face and characters (personality). This could be used to teach and educate users about what they do and how they play as tools, entities and as standalone characters. Some of the players may need more than one character to fully show what and how they interact. 21. If we could get it interactive enough, we could help show the users every step of the way what they are doing and how it fits in to the whole picture. Step-by-step – cause and effect, “visual”. 22. When showing graphics do we want to use static images, image maps with links, i-frames (windows), pop-ups, or interactive flash content? Maybe two different versions, one that is friendly to people and one that is friendly to search engines. 23. How do I keep it engaging yet logically simple? This might be a tight balance. Maybe show it very simple at first and allow the user to get more in-depth or technical as needed. Another strategy is to show it simple and then build layer upon layer until you get the full scope. This building idea takes more effort but might help the users see how things fit together better. 24. Just an idea… I’m worried about filling all the gaps and holes. What if we leave some gaps and holes and just show the users where things are at. The game of golf purposely has traps, water, sand, and rough terrain. What about the game of accounting and business? Is the goal to make it smooth or show where things are at? Once again, it might be a balancing act. 25. If I’m tracking something… How do I show something in the middle that has an uncertain start or unknown starting time and/or value? The reason I ask this is, quite often, we are asked to pick-up right in the middle and show a valid finish (numbers and accounting). It is kind of like a river… tons of water has already gone past (both flood and trickle) but I need to track a certain set of drops from point “E” to point “F”. In order to do that, I need some way to show current players and their status. In a way, I either need the supporting details or I need a starting value that plays forward… How do you do that? Does that affect anything down the road? Is there a limit going back? Does a starting value or false floor cause problems in the future? 26. How deep do we want to go? Surface level, a couple layers deep, or the full meal deal down to the dotting of “i’s” and crossing of “t’s”? How do we help people go to the level that they want and/or are comfortable with? How do you present on this level? How do you take yourself out of the mix so that there are no bottle necks and things run efficiently? 27. When a presentation is made (of any kind) how do you let people know it exists? How do you show it in context? How do you categorize the level of the info and presentation? How do you link backwards and forwards in a logical flow? How do you make it simple so that anybody could follow the path? 28. How do you help people get an education? You can’t force it… Do you want to show prerequisites or building blocks? What about requirements before and after? What about an indicator “you are here”? Lots of variables. 29. What is the timeline for a roll out like this? Or do we just start and slowly build as needed? Basically, don’t put any sort of time line on the project and just start it with the idea it will have future growth… 30. So, instead of worrying about timelines and deadlines… Do all that you can now because it will all be needed later on. Map it out, tell the story, and help people follow the path! 31. Make running a business and accounting fun… make is a puzzle… make it a game… make it as easy as possible without losing the need to pay attention or think… 32. As I was starting to map things out (visual flow chart), I thought that we may need a couple different maps… One might have all possible bridges or connections… another one might only show the current transaction and what pieces it plays with. Maybe we could even show a sample transaction and how it plays in. Maybe show the 10 or 20 most common transactions and what happens. 33. What about the element of time? This is a constant and part of the puzzle. A big part of the puzzle… 34. What about a hybrid graphic to help map actions. 2D – who are the players… plus a 2nd or 3rd 2D graphic as to the timeline and or physical relationships… Put them together to show the interactions. (Sketches in photo gallery, page 6) 35. How can I make the application map itself? Every possible roll call situation would need to be documented, scripted, and mapped. If the application could look at what happened (relative connections) it could display a real time map or visual flow chart. 36. If we are talking about smart object and/or transactions. We could also talk about smart reports, known issues, and full on automation of data flow. Along with automation… we will need to provide ways to back things out or correct known issues. Make the charges, record the history, and show a new flow chart or diagram. 37. Some modern software programs have a dashboard or graphical reports about key features. We could either use that feature or provide some sort of virtual drivers chair or cock-out (control seat) with all system controls and reports. 38. Wouldn’t it be cool if you could build virtual pieces or items (potentially 3D objects with relationships) and then drag and drop or physically put the pieces where they go? Basically, all of the tools we have created already would be used to put and build relationships (behind the scenes). The new piece would be on the user-side and would be a virtual environment where you can do your work and put things where you want them (interactive console or work environment)… This is sci-fi theory…! 39. On a different note, there is a known gap or hole if using special line items on incoming PO’s. Three possible solutions exist (right now)… One, we map the special line items to expenses or cost of goods straight from the PO’s and then pay for the entire PO through a B.S. inventory account. Two, we allow for some smart logic when paying for PO’s and help users split the specials off at that point. There are problems with both options as they exist right now. In scenario one, the full value must be deducted at once and it might seem weird to map backwards to the incoming special line items... (Not sure?) It might be better to use expense types). The second option also has a problem because it requires you to eat the whole cost at once and only shows up for roll call when you pay for it. This could be months between when you get it and when you pay for it. The third option is to satisfy the incoming PO with a series of PO payments assigned to the correct accounts. This gets the items booked right away. The catch is that you don’t pay the expense/receipt and turn the PO payable into a split payable (on account) for the vendor. The problem here is that you need to do double work and then have a split to pay off instead of a PO payable. 40. Once we get all of the mapping done. Why not use the map as a navigations tool (right from the homepage)? Show the history homepage report in a graphical manner. If people are stuck, show them what is needed, next, or possible options. Use the graphics to help lead them down the paths that will show them what is needed, or what we (the system) are waiting for. 41. Idea on making the map(s) dynamic. Allow corps to show/hide certain features like floorplan, stock/units, parts, rei’s, statements, rentals and reservations, etc. Maybe also allow them to move the pieces where they want. This could go even deeper if they have a rental fleet or layout of units. You could potentially stack, sort, categorize whatever it is that you have so that it matches your business. You could map your lot, your building layout, your warehouse, your restaurant, your clinic, your rooms, etc. 42. These are a couple of random ideas that I had in another notebook and have in another notebook and have a spiritual side to them. However, I still think they apply to adilas and where we are going… - Procedures (changeable) vs. Doctrine (unchangeable) - “Teach them correct principles and let them govern themselves.” –Joseph Smith - Teach people to think. They will take care of the rest… - Help the people catch the vision… This will drive them… - There is no new silver bullet. We need to use the tools and programs that already exist… - Bring it together… Everybody is playing on the same team! - A solid base supports the whole! 43. People want to see simple grouped reports. I (adilas) have a tendency to show details and expansive reports with every possible options and value. They have great data but they may not be what people are looking for. If I could say just a couple of words “simplify”, “cut to the chase”, “simple grouped with drill-downs to the details (if needed). Just show me the groups, categories, and the number totals. 44. Are we building and spending our time where we (Brandon & Steve - adilas) want or where our clients want? What do our clients want? What have they said? What have they not said but hinted or eluded to? What are we missing? - “If we help enough of them get what they want, we will be able to get what we want.” – Rough quote from President Leo Price (2/8/09) 45. Most of the comments on this page and other pages have been leaning towards a global watcher type system. This is not meant to deflate that idea but what if the flags and watchers and spread throughout the entire application with the tables that already exist (go to the source). The reason for this comment is I’m thinking about upkeep and system resources. The beauty of adilas is the depth and direct link to the underlying details. Maybe think about each main item carrying its own details like baggage. If I put the flags and dates in the right place we can easily pull reports and jump to the correct players. 46. Accounting is not so much the numbers… It is who and what are playing over time. We are dealing with independent objects and how they grow, shrink, live, die, play with, help, support, tie, bind, interact, skip, connect, and other actions. Let each object live and track what it does and make it accountable for its actions… wow, that’s deep! Almost spiritual… 47. Remember the whole picture… This is not just about the accounting. We need to remember that time plays into the operations and daily actions as well. One of the constants is time… Inside of adilas there is the effectual or what shows up for roll call. There is also the historical or who touched what. Both deal with the element of time. What about the financial side? 48. What if we beefed up the flex grid tie-ins… we use them as watchers, feeders, etc. We could set-up dynamic drop-down fields (for any of the 10 flex fields). We could beef up the search options and reports. We could also allow for the roll call or reflexive side of the flex grid to be used. 49. There is a known issue if people/users are using adilas as a cash register. On the one hand, we are recording invoice payments coming in; on the other hand, they (meaning the users) might be taking cash out for expenses (like a petty cash draw). If they (the users) are not going to the deposit and bank level it might be okay but there are some cause and effects that didn’t get recorded. How can you simply help people who want to do that kind of transaction? Here are some options: - They need to record a negative invoice that doesn’t count towards revenue (special line item with a black hole assignment). They also need to record the negative out flow or payment. When they do their deposits, they deposit the negative payments right with the positive payments and it works out okay. - What if they were able to tie to “cash” expense/receipt payments from the amount to deposit? Basically, create some sort of secondary line item that back tied itself to an expense receipt. That would be the negative side of the equation. - What if you had some way to tell the story of where they money went? Allow and create tools to tell the story so that we can account for them, not double things up, and keep the loop tight. That is a challenge! 50. On the global watchers – what if you called it locations, layers, and level. A super mini version of this already exists inside of adilas. It is the location ages and floorplan history for stock/units. Basically, we are looking for who, what, when, where, how much, and how long… 51. Good consulting and education may be better and more important than good programming! 52. What if any object or sub object could be pointed into play or told how to show up for roll call. What if that could be flexible on a per item or sub item basis. Basically, set a standard and default to that. If special, have the tools and permissions in place to let things play where ever you want in the final game or layout. 53. To take this “any object to any place” methodology even further… what if this becomes the watcher or watcher(s). This could be 1-many on dates and status. The roll call then knows where to show up and how and when to play in to the mix. Basically, a default roll call is either assigned or presumed. (Keep the footprint small or inline). Then if needed, only on special cases, allow for the 1-many to happen as “any object to any place”. At that level you’re playing with where and how things show up to play. Full control and full flexibility. Maybe only add a “custom mapping or roll call” if needed… otherwise let it flow naturally. 54. The system would need to track exactly what was happening and be able to show effectually and historically what was, is, and will be where and at what timeframe or in what window. Funny how it comes back to time… 55. Maybe time is the stable element and we organize events and objects inside of the time windows. 56. Space??? Time??? Time space??? That could make a pretty good 3D model. You could even push, pull, move, slide, and shuffle objects to create a sense of virtual time travel (past, present, future) with in the application. Only recorded data would be able to play. You can’t pull something out of nothing. Without getting too deep… the element of space is how you organize items and objects into logical pieces. Catch and hold all of the pieces and then be able to show them back again. This becomes the accounting or story of what happens in your space. 57. Old school accounts want to see the entries that were made. What if you show the database entries that were made and show them how to map back to it? This could be a nice presentation with graphics or just a pen and paper and physically showing where things go and how you can look them back up. Draw out tables, containers, etc. Show them on paper where things are at. Simplify some of the look-ups and keep it to a minimum (don’t be so detailed that it makes it hard to follow). Simple. 58. To make the above simple demonstration even more powerful. Once the entire transaction is mapped out on paper… take them in to adilas and show the same transactions using the system. Compare the map with how the system works. Maybe allow them to choose what they want to see. A decision or linked tutorial. 59. For the record, there are some other known holes and issues: (balance sheet related) - Credits (vendor and customer), payroll settings for all states, payroll reports, accrued payroll, year-end reports and forms, sales tax reports and forms, build and hold recipes, build and build recipes, conversion of a stock/unit into parts inventory, hard core manufacturing, process vs. discrete accounting, depreciation and amortization schedules, schedules and rentals, other items discussed in this brainstorming session (see previous notes and questions). - Some of these already have a work around but they could use either some help and/or documentation/training. 60. Jumping back to 58. It would be really cool if a tutorial had subs. The user could either view the entire thing, just a sub step or chapter, or be able to jump to what they want. Maybe have an outline for each tutorial, sequence, or presentation. If the user is in a hurry, allow them to look at the outline and jump to that section. On a technical note. That may require the player to have an active playing piece and a next up piece that is being downloaded. If the user jumps around, the player would need to shuffle the pieces. Just an idea… but maybe that map or outline could be its own clip or movie that could stay loaded until the user is done with that clip or section. It would also be cook if the player could be smart enough to show related topics and additional clips. 61. In the theory clips… show web basics, how 1-many works in a database, client/server relationships, dynamic searches and filters, history and approach, what are the technologies that are playing and what each does, show how relationships are created, how things interconnect, and what things standalone. In a way, pretend that you were teaching someone new how to build a web based relational database application. I know it sounds like you are giving away the farm but I really feel strongly about helping other people learn and understand what is going on. Think about Steve and I and how we communicated, because we can talk at that “full picture” level, we can keep dreaming and taking the next step. Conditional logic, new settings, 1-many relationships, short cuts, links, loops, where things are currently, where we would like to take it histories and how we can get there. 62. I want to make sure that adilasuniversity.biz is free and open to the public. We may be able to charge for other things like system fees, training, setup, migration, optimization, merchant processing, classes, demo accounts, retail store, upgrades to different service levels, marketing and ads (sponsors), white labeling, etc. Train the upcoming generation! Help them to learn adilas so that is what they want to work in… 63. Once we get everything working, it would be awesome to go back through and hide all irrelevant items or choices. For example hide the bank if only one bank, hide the location if only one location, hide stock # stuff if no stock/unit assignments are made. Clean it up and simplify it. The process is the same; the only difference is hiding steps and making it more user friendly and faster. 64. Going back to the timeline idea… wouldn’t it be cool if you could see your revenue, COGS, gross profit, expenses, and net profit values every day. It would also be cool if your application could show a thumbs up or down (or smile or frown) for in balance yes/no. It would also be cool to show known issues and potential problems. This could almost be called a smart balance or something fun… This would be cool to add to a dashboard of sorts… 65. Add a crumb trail to the application. This would also be cool if you could visually show someone on a map where you are at. You want to know where you are at and where you are going… It would be cool if you could jump or switch places really quickly. Easy… yet flexible menus and jump spots. 66. On a jog with my dad and was thinking about using smaller flash movies inside of a bigger player. If you left the flash environment it would be cool if you could jump back right to where you were. Maybe pass a small string value to an outside request so that it would know to get back. It might also be cool to have certain major functions built in to the main player (adilas dewy decimal, permissions, etc.) and then smaller functions within the smaller flash movies that deal with just their functions. 67. How do you get depth? 1-many relationships, time, volume, layers, chaining, combining processes, pulling from a central location, multiplying, magnifying, compressing, breaking things down into smaller pieces, use over and over, only pull what is really needed, efficient layout and design. Group things, anticipate, lead from step to step, preload, copy, duplicate, and use a template system. Allow the system to grow and be dynamic depending on the user, what they are playing with, and how many are playing with the same items or processes. 68. A pencil works in space. A ball point pen does not. Keep it simple. 69. How about a visual permission map. Just another layer or mapping. |