all data is live and searchable
|
Basic Assignments
|
Options & Settings
|
Main Time Information
|
||||||||||||||||||||||
|
|
|
|
|
||||||
|
||||||
|
|
|
Notes:
|
|
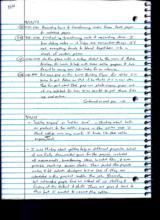
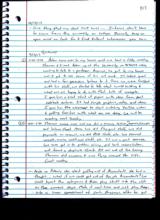
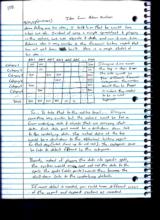
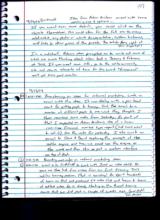
-“adilas engine” or “adilas core” – Thinking about bolt-on products to the adilas engine or the adilas core. I think either one may work. I kind of like the adilas engine visual best. -I was thinking about getting help on different projects. What if we fully documented specs for the project, included all requirements, brainstorming ideas, wanted flow, and even possible mock-up screen shots. Then posted the projects online and let outside developers bid or see if they are interested in the project and/or the job. Basically, let interested people find us instead of us staffing and finding all the talent and skills. There are pros and cons to this but I wanted to record the option. -One thing that my dad said was… Interns don’t have to come from the University or College. Basically, keep an open mind and look for and find talent wherever you can. -Note on this student’s idea about getting rid of Accountants. He had a thought… what if we could get rid of the job Accountants? We could layout the categories and then plug stuff into the slots on the correct days. Make it real-time and just plug things into a linear spreadsheet of sorts. Anyway, after he got done telling me his idea, I told him that he would love what we do. Instead of using a simple spreadsheet and plugging in the values, we use objects and data and run it over time. His idea is very similar to the financial history report that has not yet been build. Here is a rough sketch of his idea…. … Date 1 Date 2 Date 3 Date 4 Date 5 Date 6 ….. Totals Category 1 100 100 … … … … … 200 Category 2 … 10 … … … … … 10 Category 3 300 … 500 200 … … … 1000 Category 4 … … … 250 … … … 250 Category 5 200 … … … … … … 200 Category 6 … 700 … … … … … 700 ….. … … … … … … … … Totals 600 810 500 450 0 0 … … Imagine time across the top in days. Down the side would be the different financial categories. The numbers would then be plugged in where they needed to be or what happened. So… to take that to the adilas level… Imagine something very similar but the values would be fed in from underlying data and objects that are carrying that data. Each data point would be a drill-down link to the underlying data. The actual dates at the top would be a drill-down to the effectual history report for that day (what shows up for roll call). The categories could be links to details filtered by the categories. Basically, instead of plugging the data into specific spots, the system would map and roll call the data to the spots. The spots (data points) would then become the drill-down links to the underlying details. If more detail is needed, you could have different views of the report and expand sections as needed. If you want even more details, you could click on the objects themselves. This could allow for the full one-to-many relationship, any photos or outside documentation, system histories, and links to other pieces of the puzzle. The whole story right at your fingertips! In a nutshell, this student’s ideas prompted me to write out more of what we were thinking about clear back in January and February of 2011. If you want more info, go the adilasuniversity site and search elements of time for the word “financial”. You’ll get some good results. |