all data is live and searchable
|
Basic Assignments
|
Options & Settings
|
Main Time Information
|
||||||||||||||||||||||
|
|
|
|
|
|||
|
|||
|
|
|
Notes:
|
|
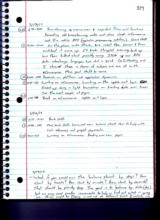
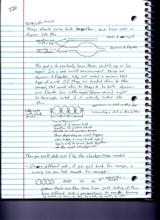
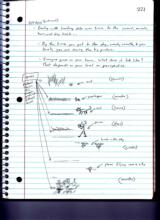
-What if you could run the balance sheet by days? How about by hours? How about by minute? How about by seconds? That should be plenty deep. The goal is to balance by date (day) but we may need smaller increments to help us find out what is going on. Things might by flexing in and out at different times. Eventually things come back together. We have used a diagram like this: (diagram in notebook – operations are on the top, accounting is on the bottom – shows to lines that are static and rigid, then shows two lines that bubble out and come back to parallel – dynamic and flexible. The goal is to eventually have them match up or be equal. In a real world environment things are dynamic and flexible. Why not match or mimic that type of world. If things are tracked down to the second, that would allow for things to be both dynamic and flexible. Our little model (diagram above) might be too simple. What if it actually looked like this: (sketch in notebook) Life cycle with check points… operations is still on the top, accounting is still on the bottom. What if it comes back together for certain check points or at certain times. Then depending on what happens over time, it may break apart again only to come back together at the next check point. Then you could date and flag the checkpoints as needed. -On a different note, it you pull back far enough, a wavy line can look smooth. For example: (sketches in notebook) …. Pretend these are the same lines just looking at them from different levels or perspectives. For example: by second, by minute, by hour, by day, by week, by month, by year. -Dealing with tracking data over time to the second, minute, hour, and day levels… -By the time you get to the day, week, month, and year levels, you are seeing the big picture. -Imagine grass on your lawn. What does it look like? That depends on your level or perspective. (Sketches – pretend this is the same grass at different levels: ant – seconds, grasshopper – minutes, cat – hours, person – days, birds in the sky – weeks, plane flying over a city – months.) |