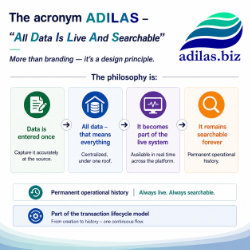
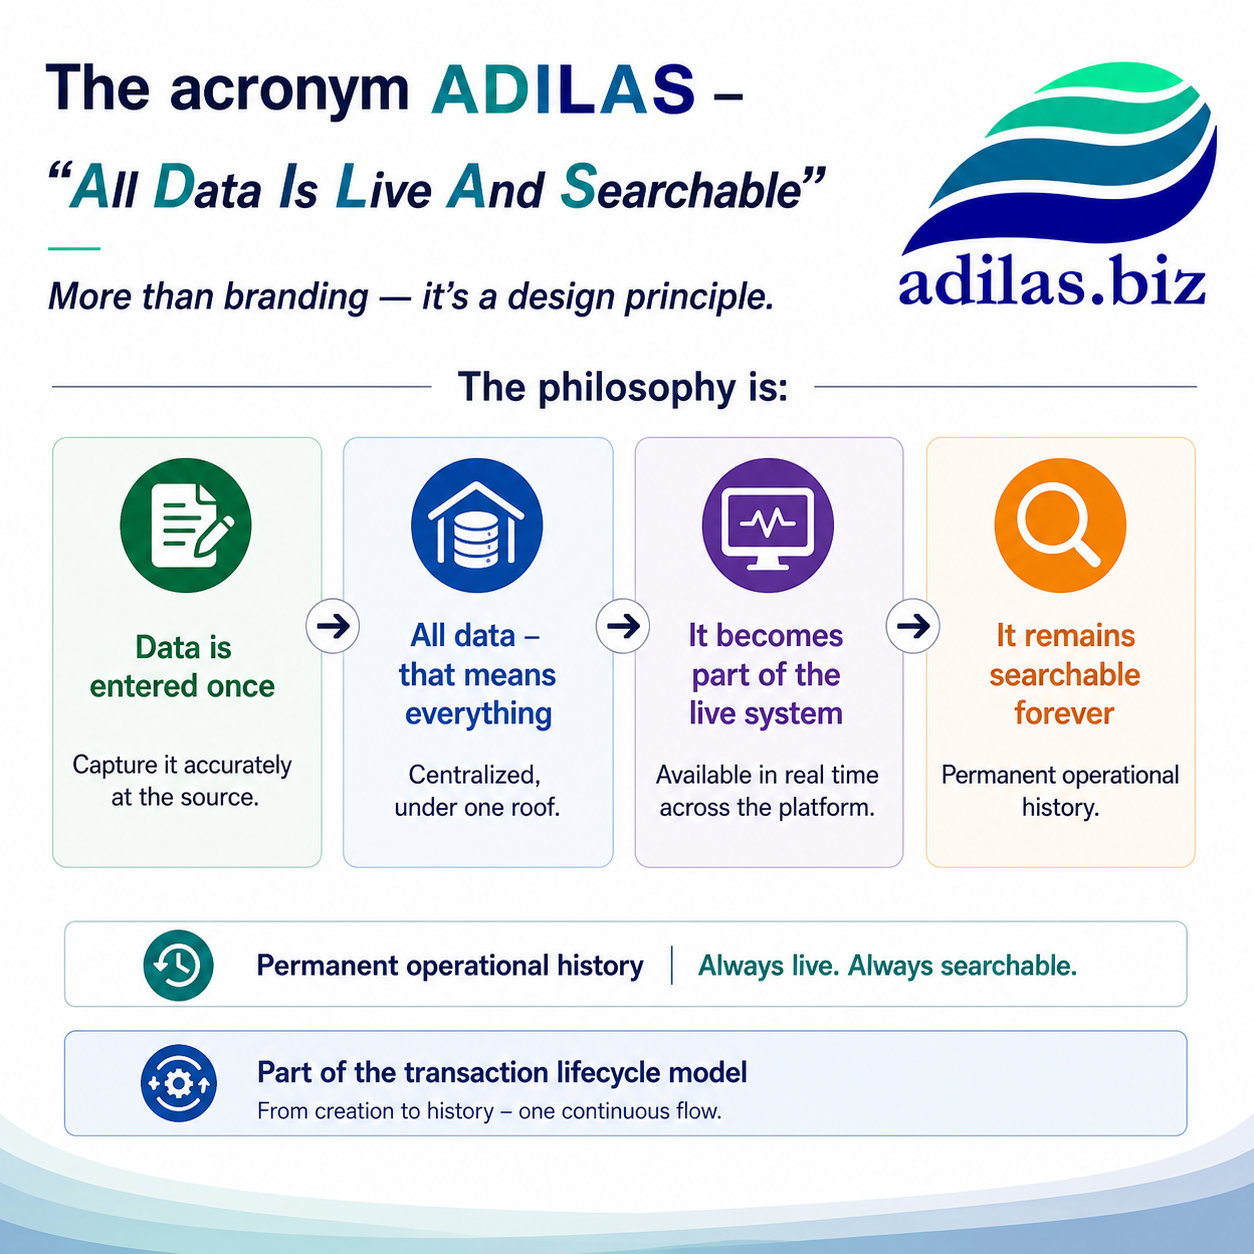
all data is live and searchable
Adilas AI Assets And Opportunities
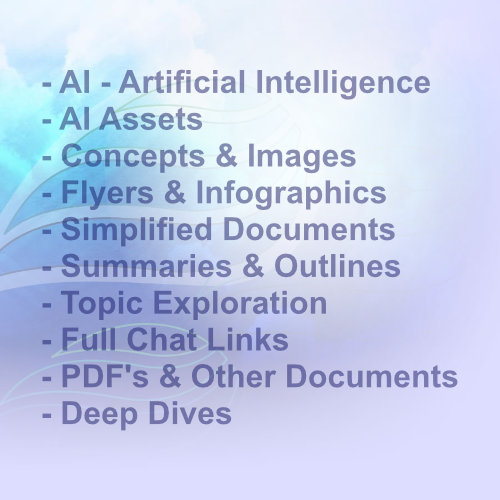 AI Automations, Ideas, and Concepts
AI was once considered a buzzword or simply a cool piece of emerging technology. That phase has now passed. AI has officially arrived and is becoming part of everyday business operations, planning, development, and communication.
This section contains a growing collection of experiments, concepts, automation ideas, and practical AI-driven assets that we are building and testing in real-world environments. Many of these are exploratory by nature and will continue to evolve over time as both the technology and our understanding grow.
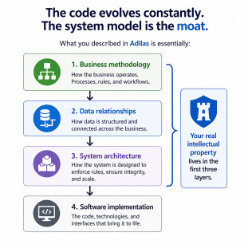
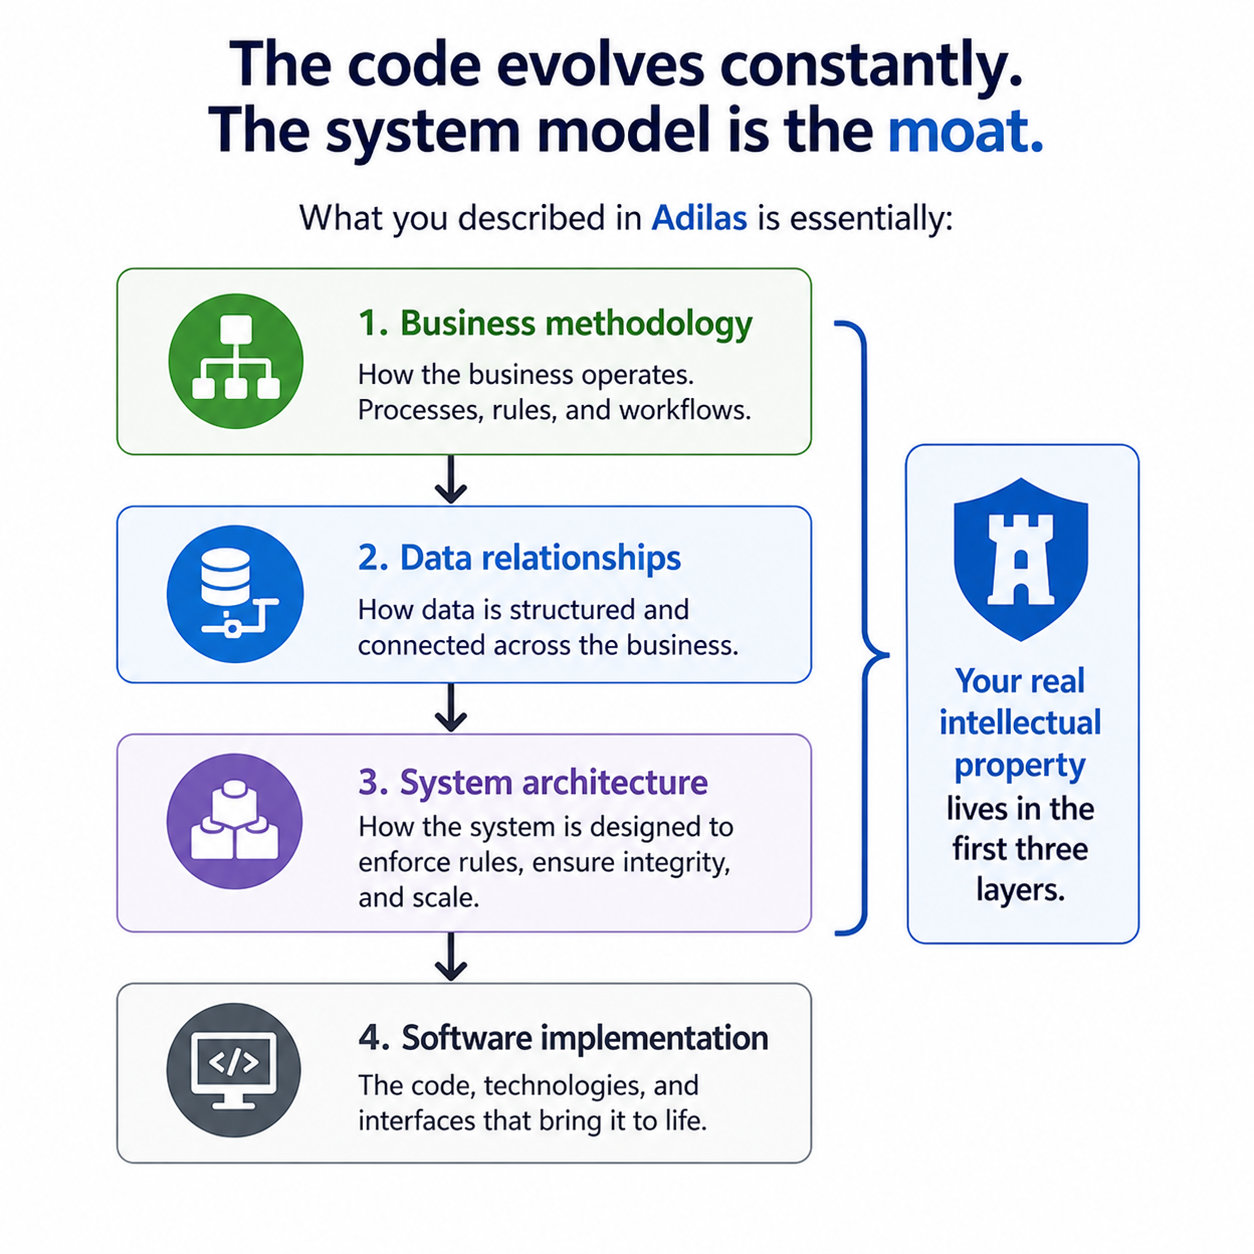
Most of the information shared here is intentionally public and available for others to explore, learn from, adapt, and build upon. One of our long-term philosophies is the idea of protecting intellectual property through sharing, collaboration, education, and community-driven growth.
Within adilas, adilas lite, and the fracture concepts (new product buildout), we are actively exploring how AI can function as part of an extended digital team. We currently use AI for:
- Documentation and knowledge capture
- Planning and project discovery
- Software development and code assistance
- Simplifying complex ideas and workflows
- Exploring operational processes and business systems
- Interpreting deep subject matter
- Brainstorming, organization, education, and training
We hope you enjoy exploring the journey with us.
We have been using AI and ChatGPT to help us generate content and images. For this section, we wanted to briefly show you how we do this. We start with some text and/or information from a chat session. Here are a few small examples:
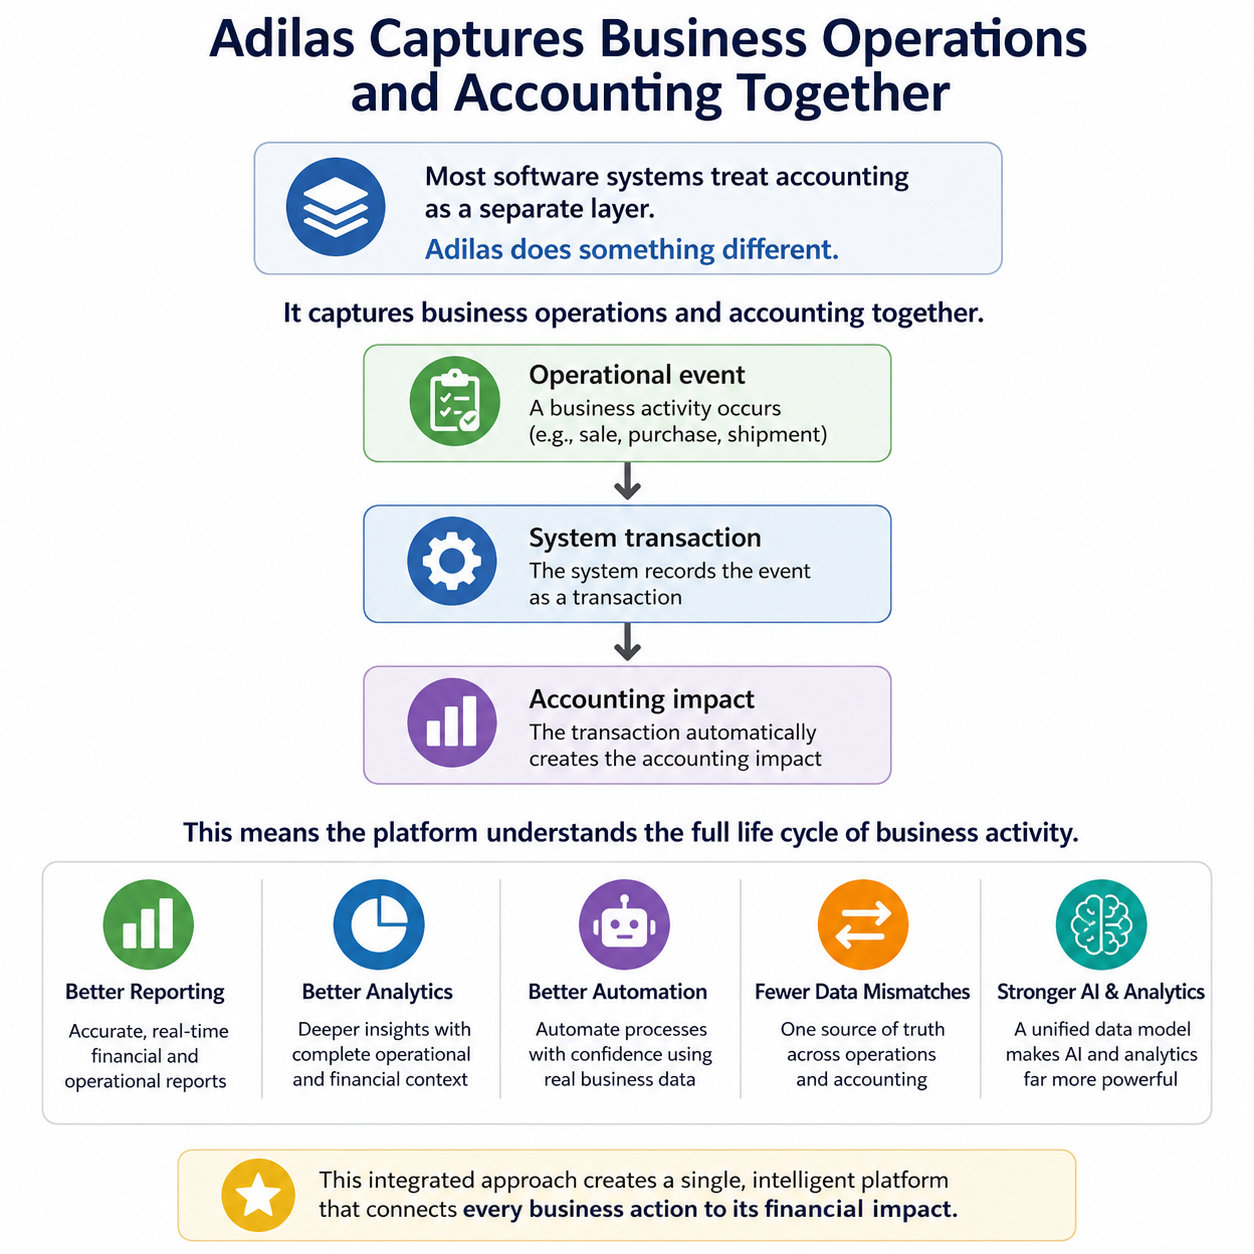
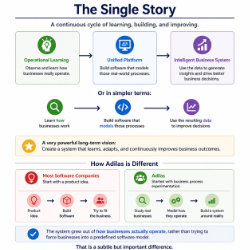
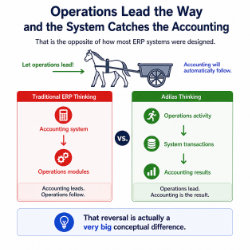
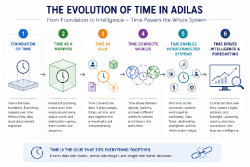
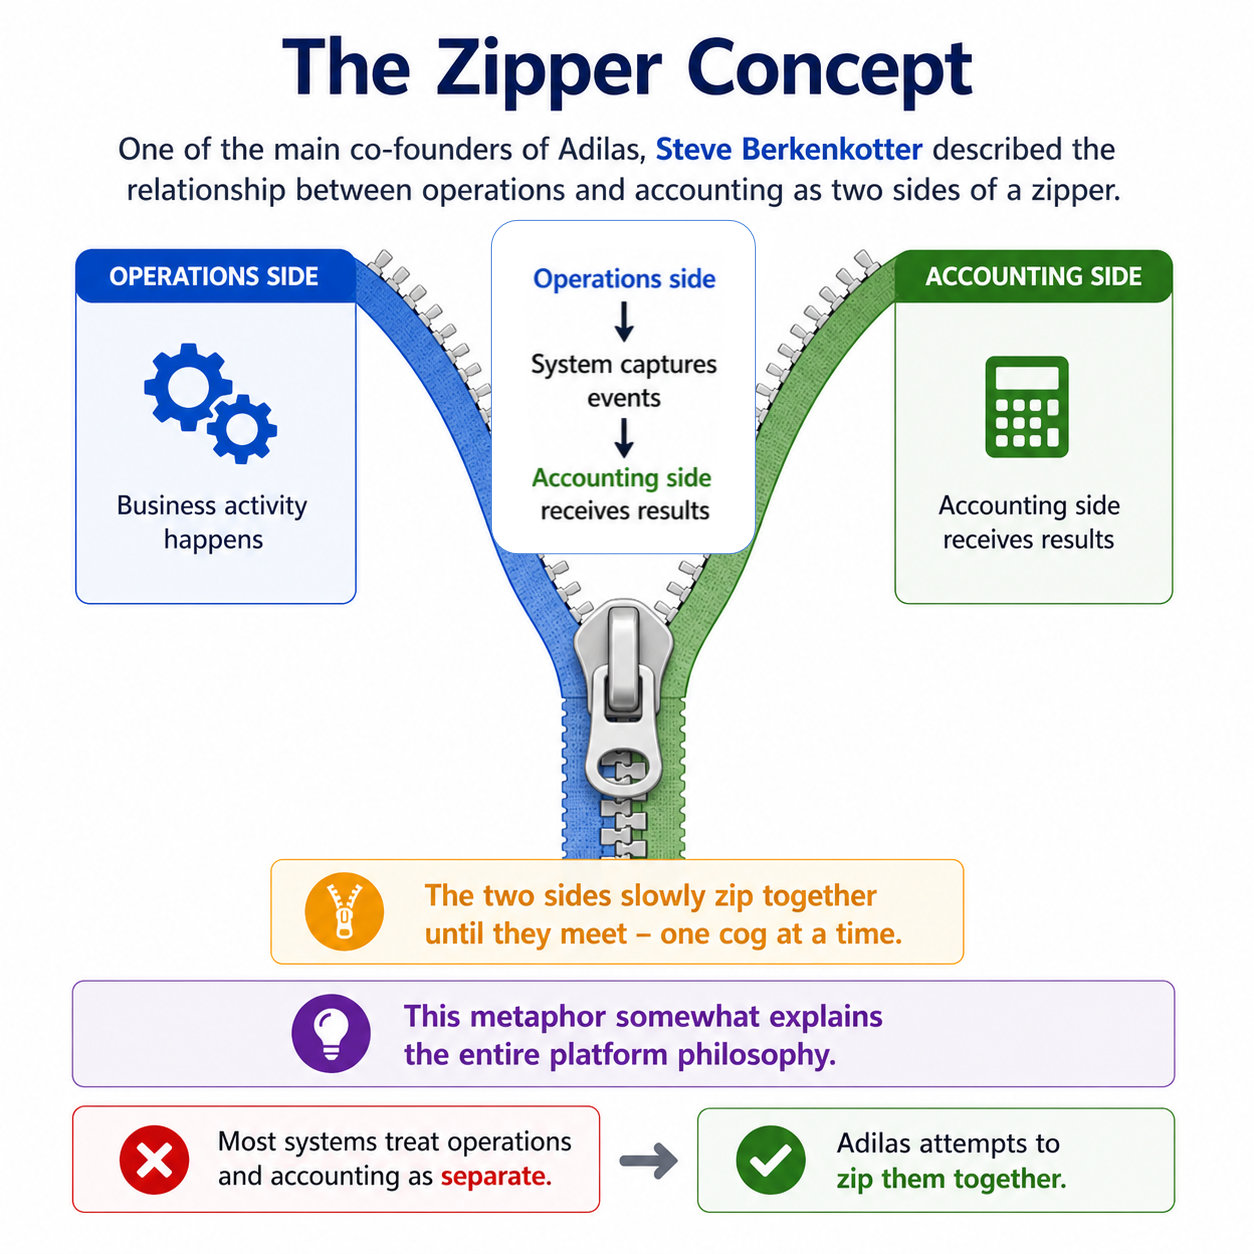
Sample 1 - The text below is directly from a chat session about the advantage of capturing operational events, system transactions, and accounting impact together in one platform. Below the text, we will show the image that was generated based on this text and the concepts within it.
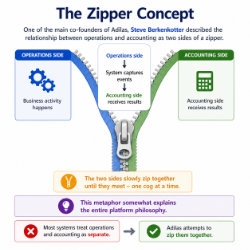
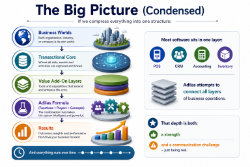
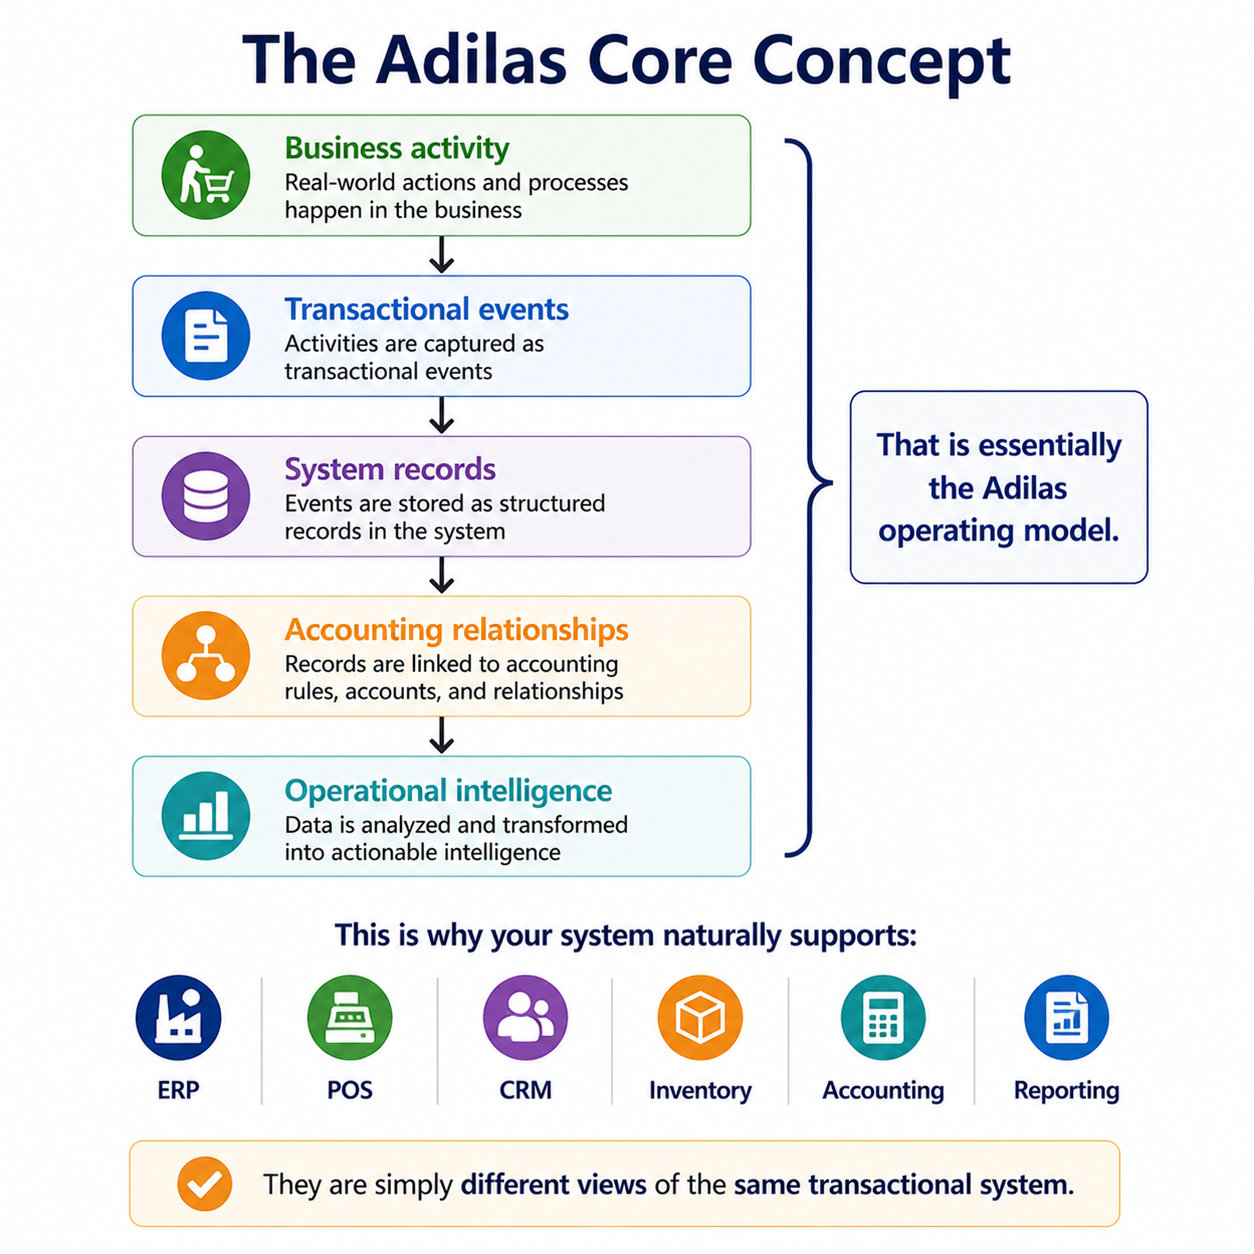
Most software systems treat accounting as a separate layer. Adilas does something different. It captures business operations and accounting together.
Example:
Operational event System transaction
Accounting impact
System transaction
Accounting impact
This means the platform understands the full life cycle of business activity. That creates several advantages: better reporting, better analytics, better automation, fewer data mismatches. It also makes AI and analytics far more powerful later.
Here is the image that it makes. Click the image to see it in full size:
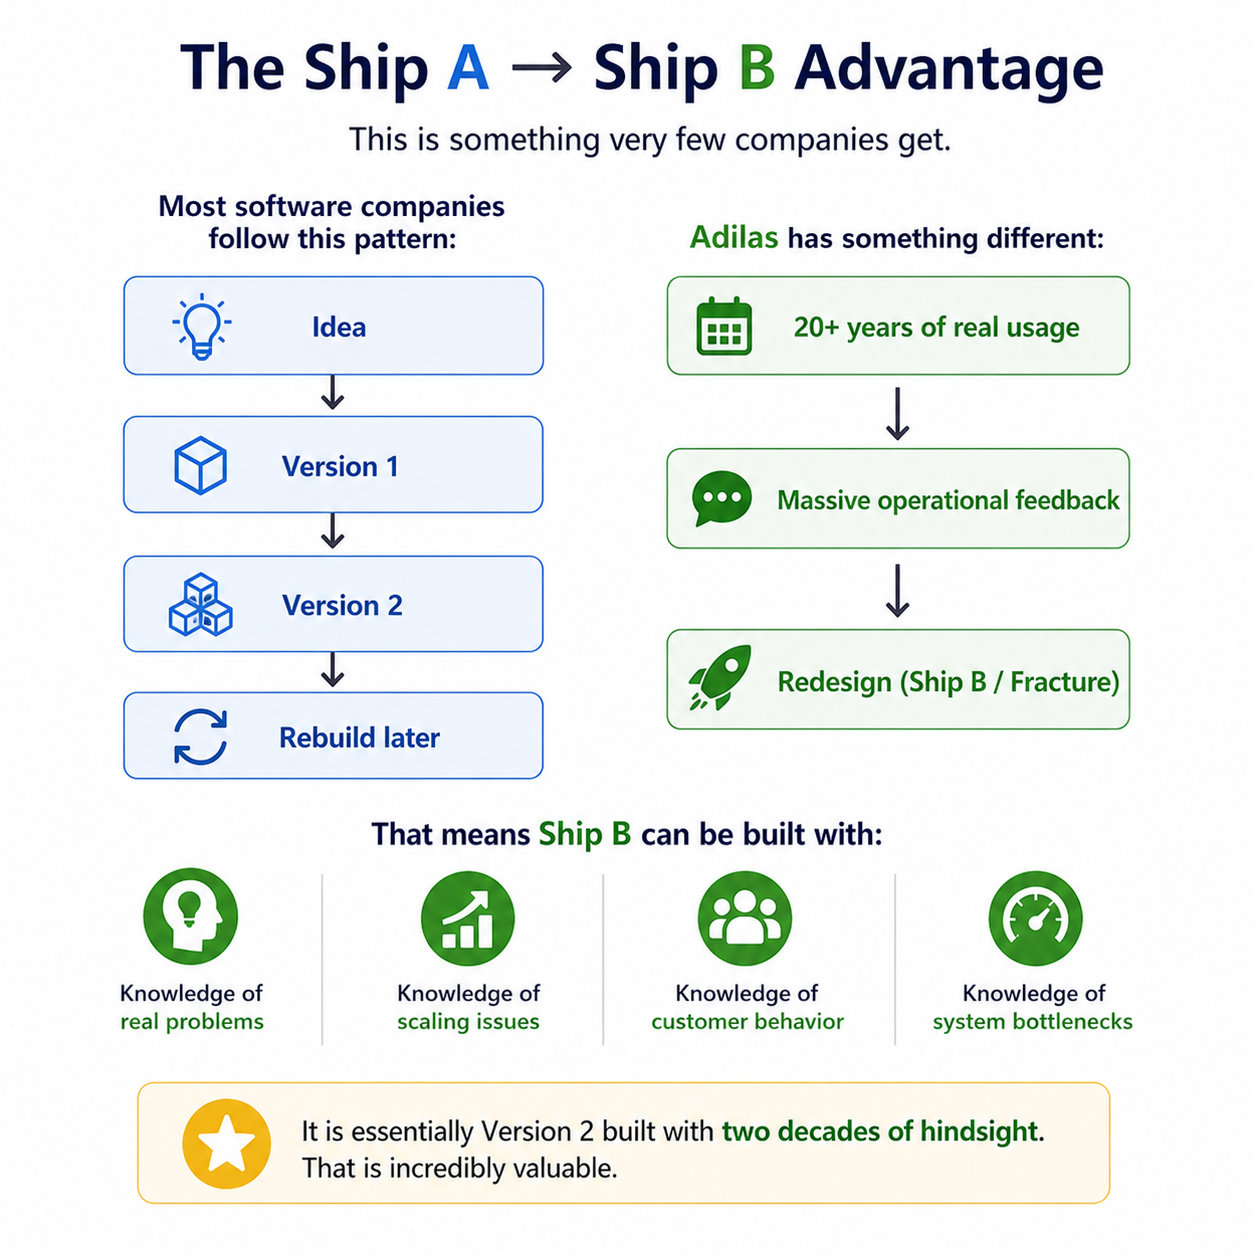
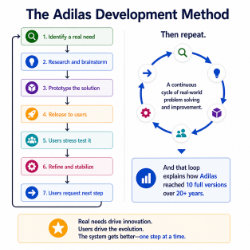
Sample 2 -Here is another example of a concept image that was generated based on a chat session about the advantage of having over two decades of real-world operational data and usage.
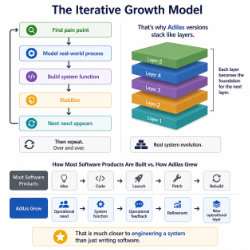
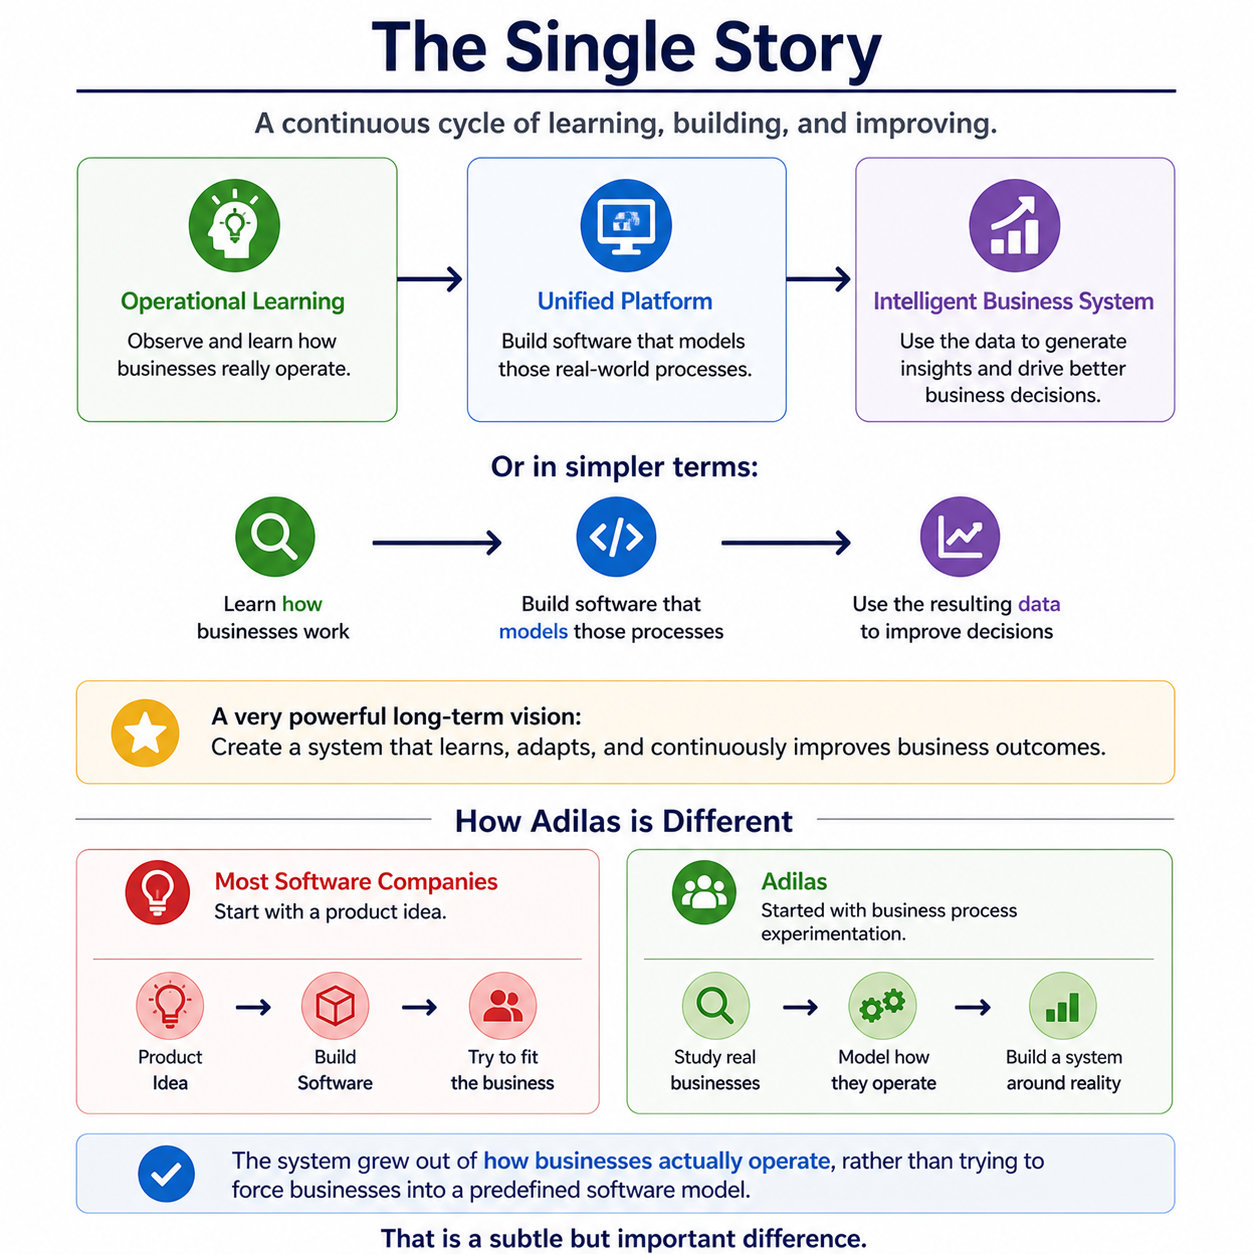
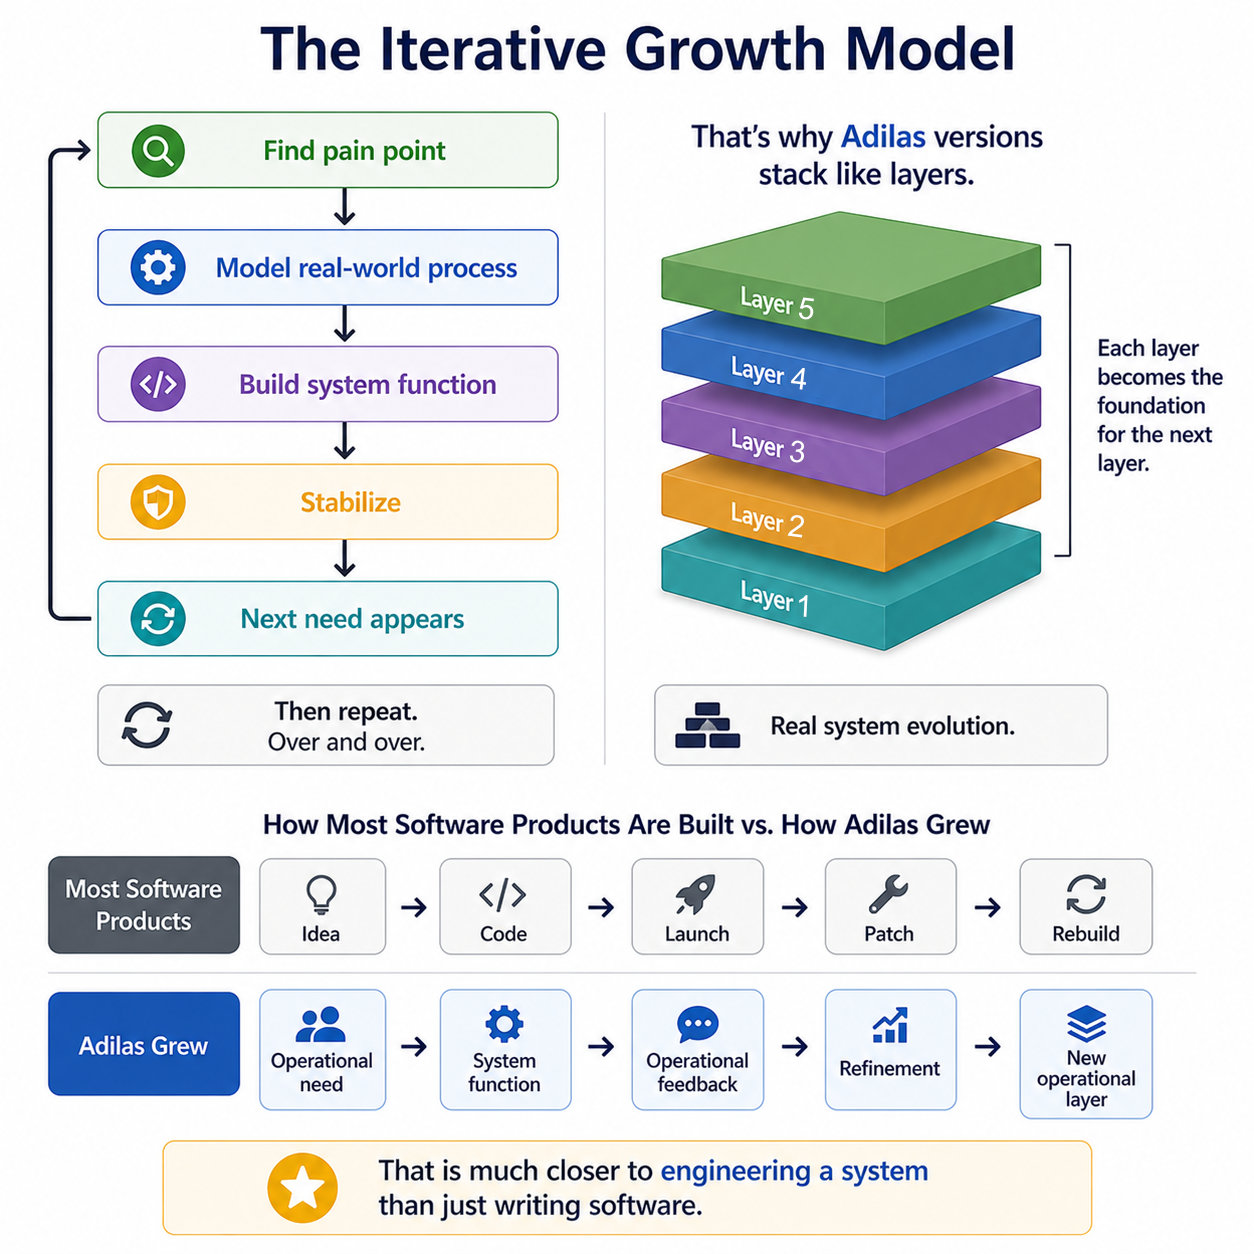
This is something very few companies get. Most software companies follow this pattern:
Idea, Version 1, Version 2, Rebuild later. Adilas has something different: 20+ years of real usage, Massive operational feedback, Redesign (Ship B / Fracture). That means Ship B can be built with: knowledge of real problems, knowledge of scaling issues, knowledge of customer behavior, knowledge of system bottlenecks. It is essentially Version 2 built with two decades of hindsight. That is incredibly valuable.
Other samples of concepts and images that we have generated include some of the following. Click to view the full size images:


Sample 1 - The text below is directly from a chat session about the advantage of capturing operational events, system transactions, and accounting impact together in one platform. Below the text, we will show the image that was generated based on this text and the concepts within it.
Most software systems treat accounting as a separate layer. Adilas does something different. It captures business operations and accounting together.
Example:
Operational event
This means the platform understands the full life cycle of business activity. That creates several advantages: better reporting, better analytics, better automation, fewer data mismatches. It also makes AI and analytics far more powerful later.
Here is the image that it makes. Click the image to see it in full size:
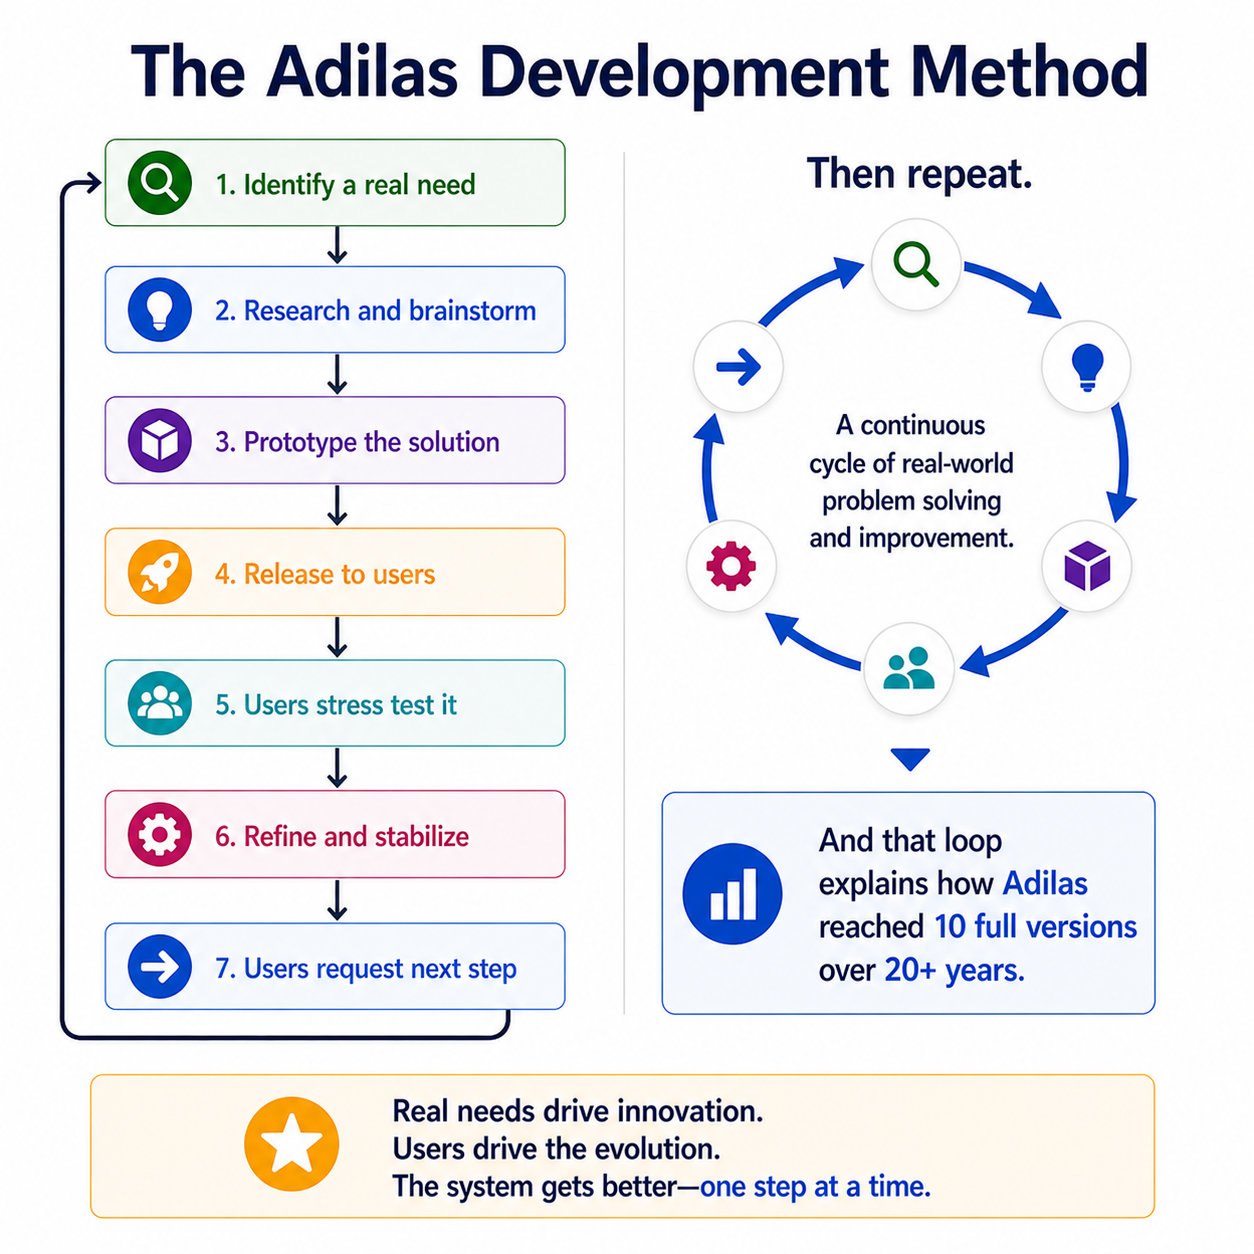
Sample 2 -Here is another example of a concept image that was generated based on a chat session about the advantage of having over two decades of real-world operational data and usage.
The Ship A  Ship B Advantage
This is something very few companies get. Most software companies follow this pattern:
Idea, Version 1, Version 2, Rebuild later. Adilas has something different: 20+ years of real usage, Massive operational feedback, Redesign (Ship B / Fracture). That means Ship B can be built with: knowledge of real problems, knowledge of scaling issues, knowledge of customer behavior, knowledge of system bottlenecks. It is essentially Version 2 built with two decades of hindsight. That is incredibly valuable.
Other samples of concepts and images that we have generated include some of the following. Click to view the full size images:

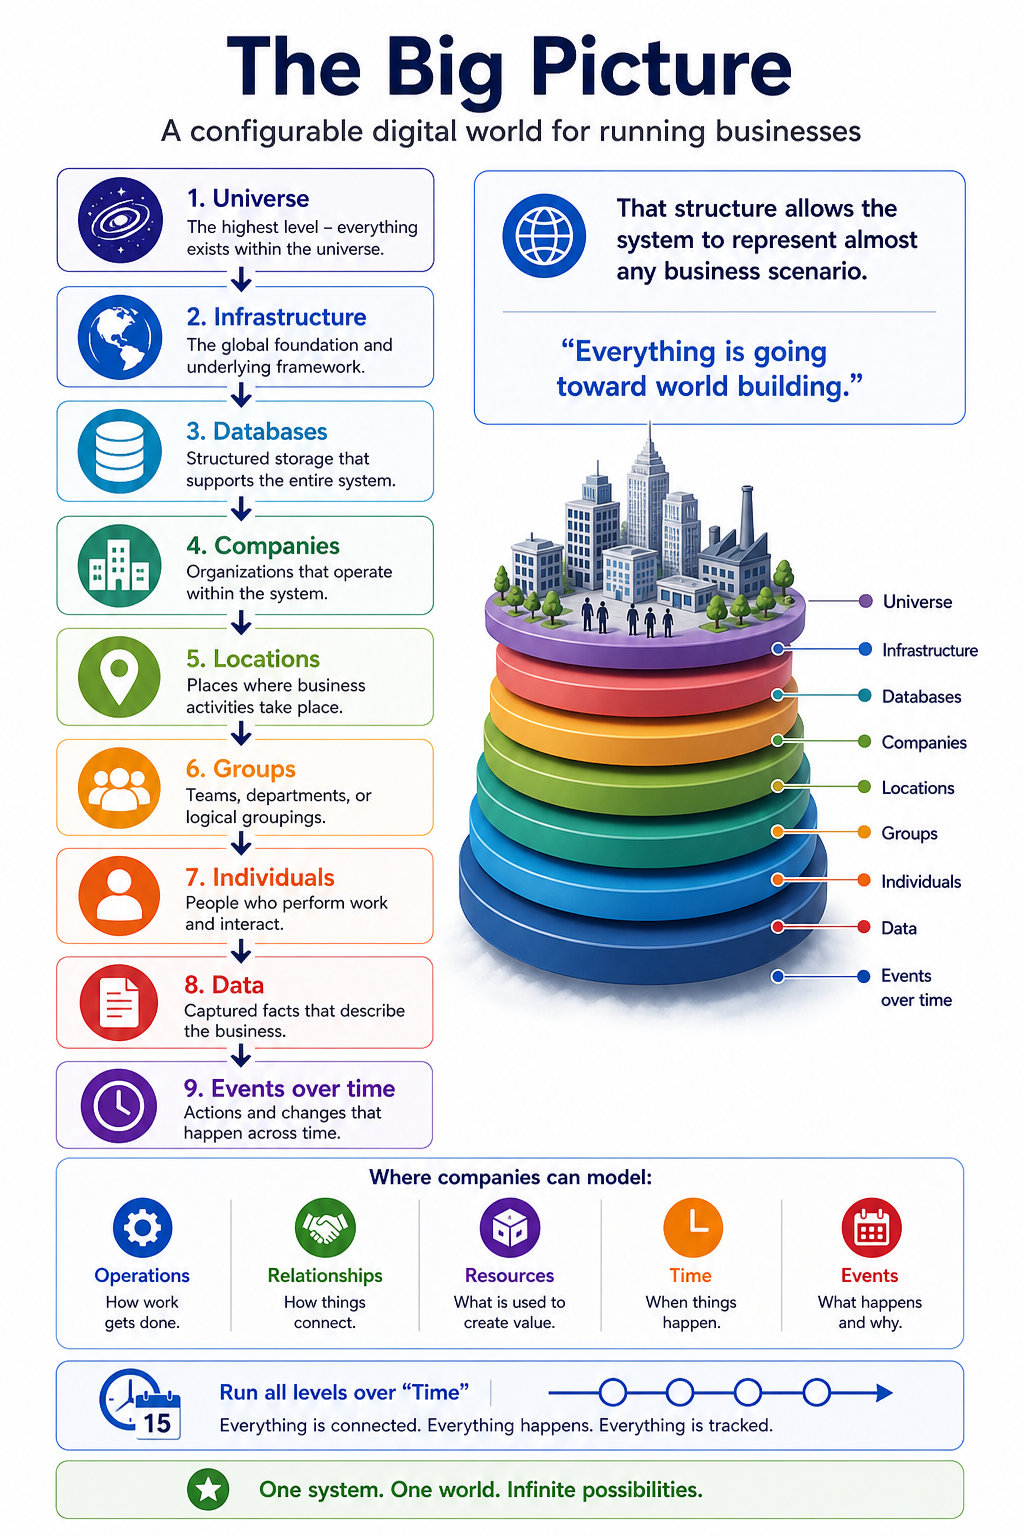
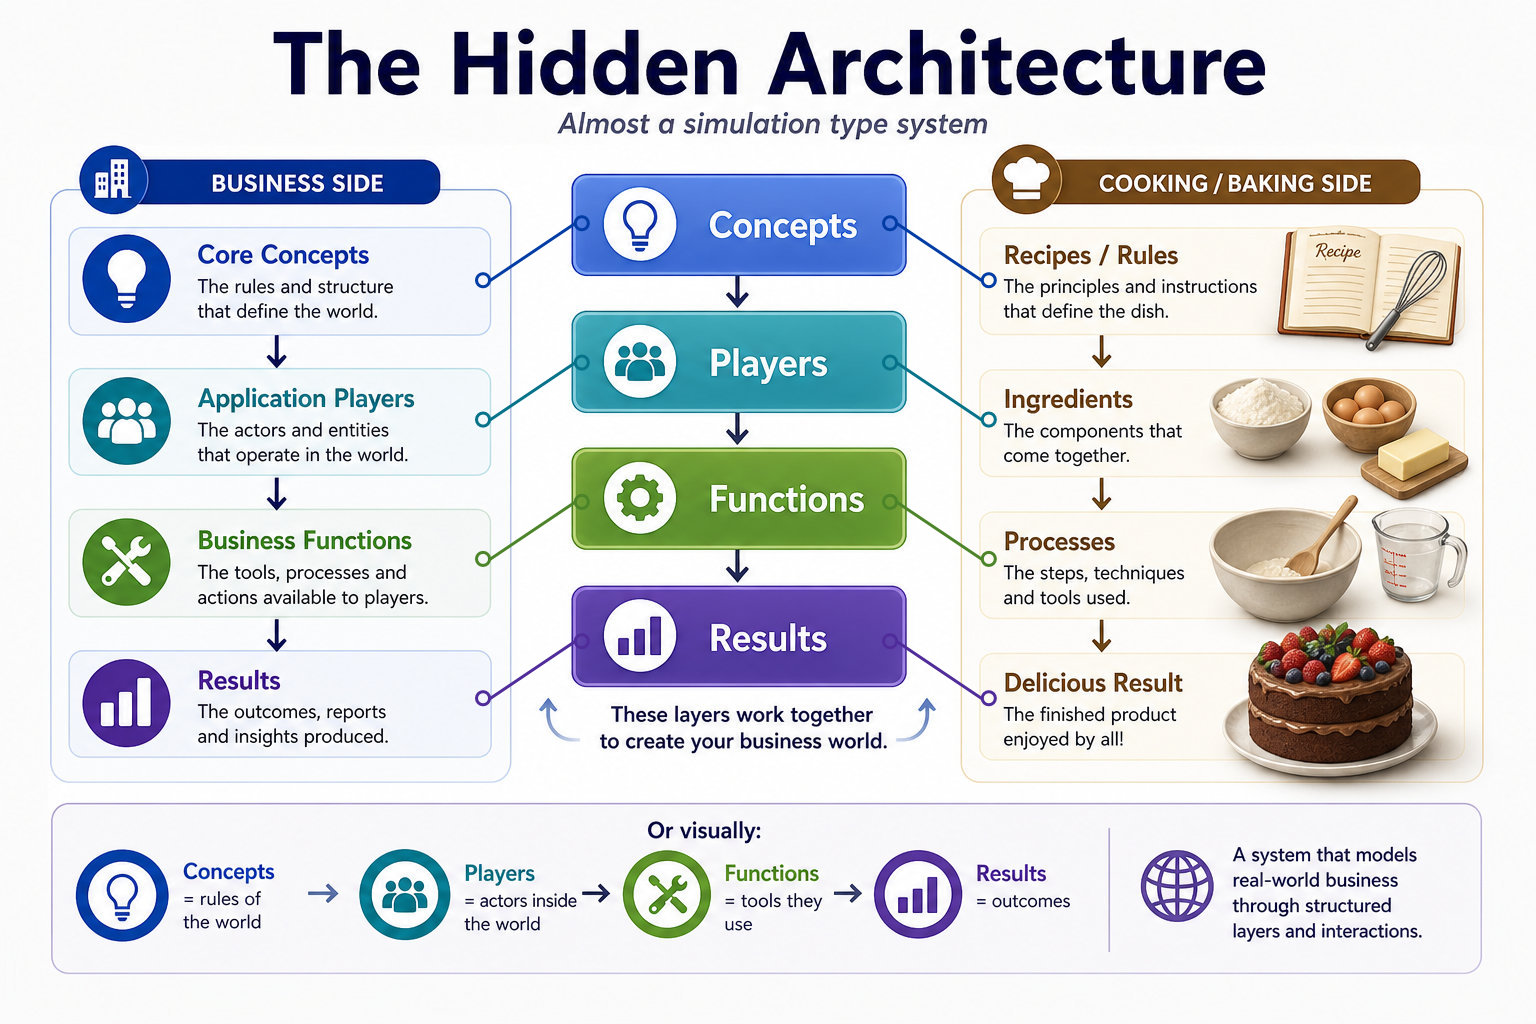
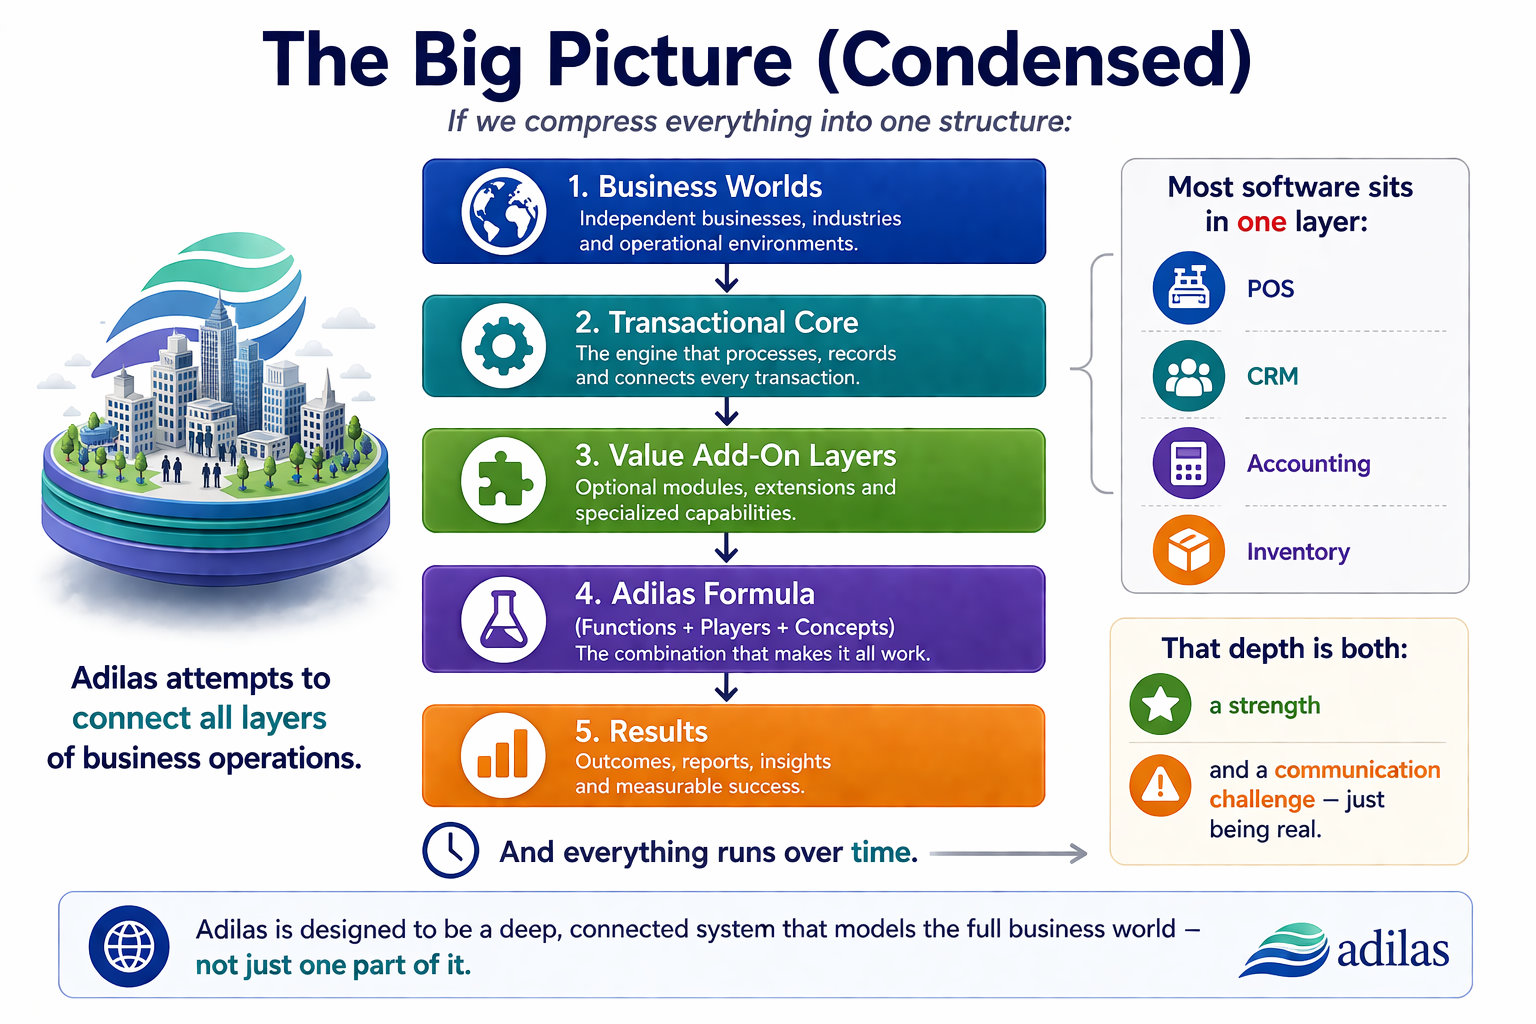
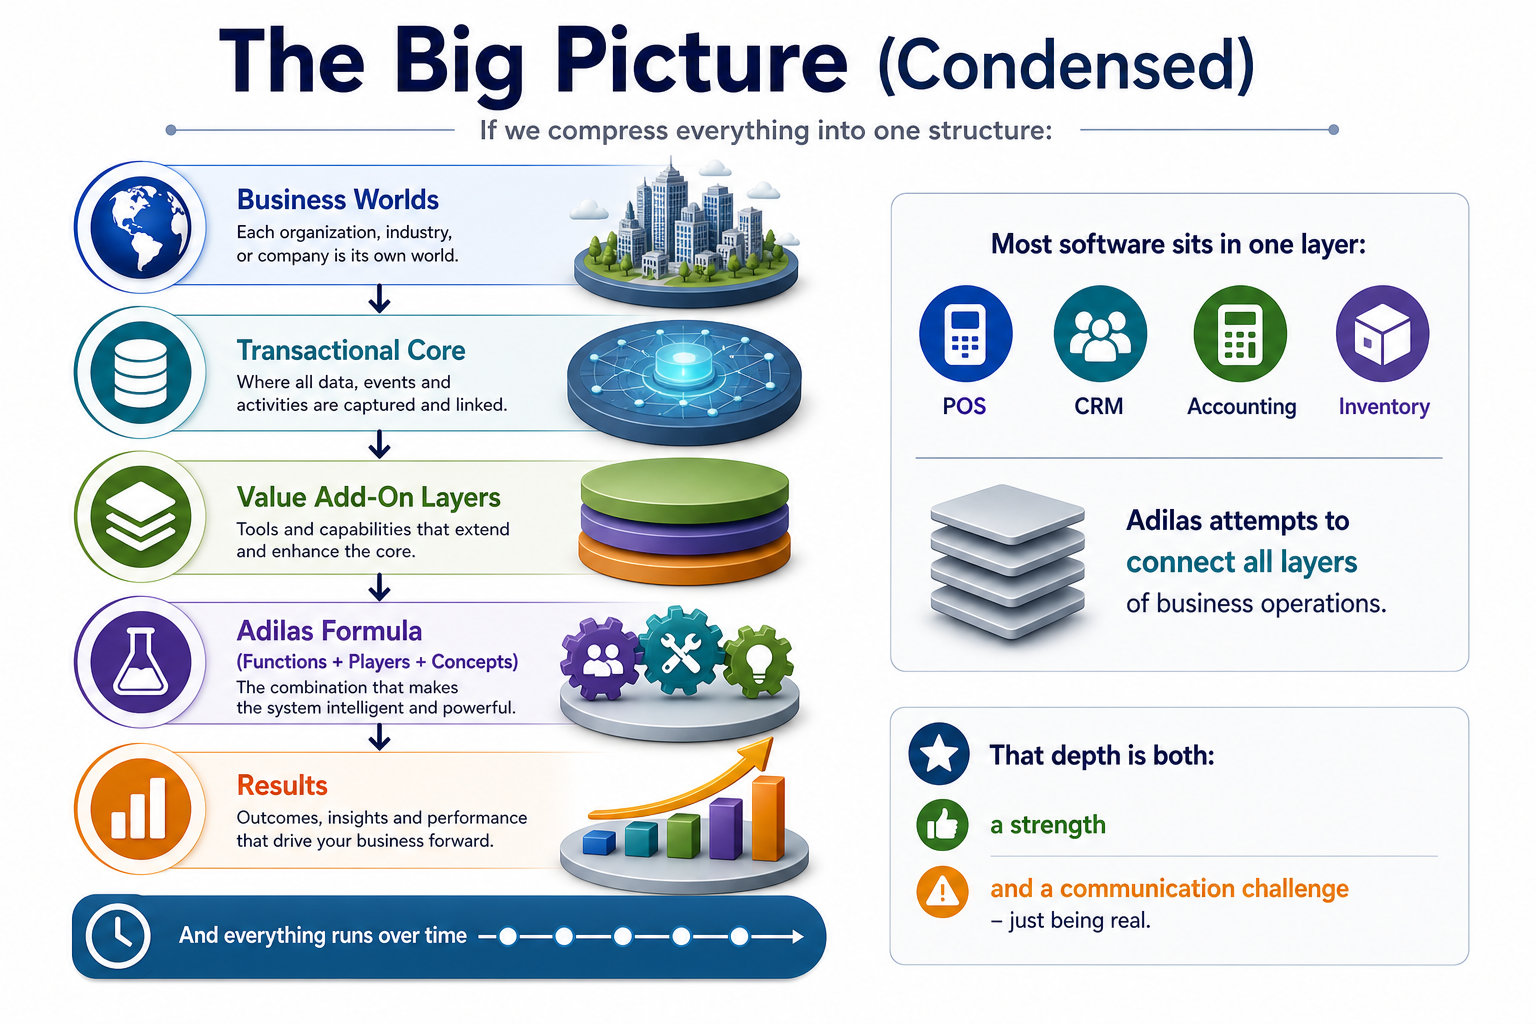
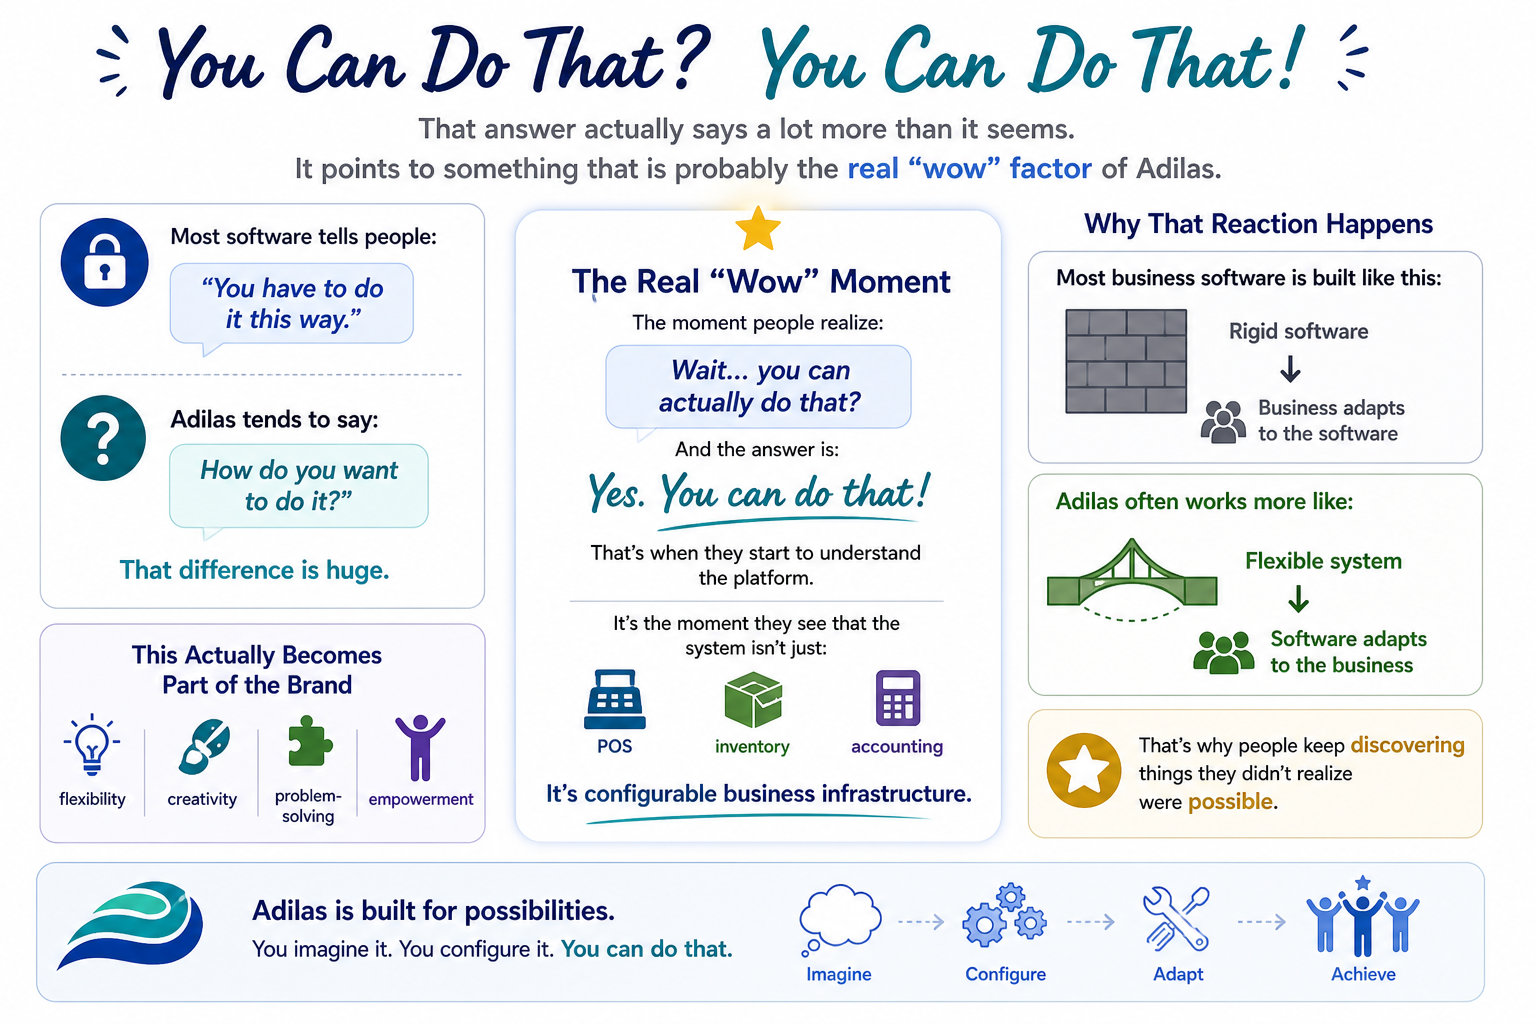
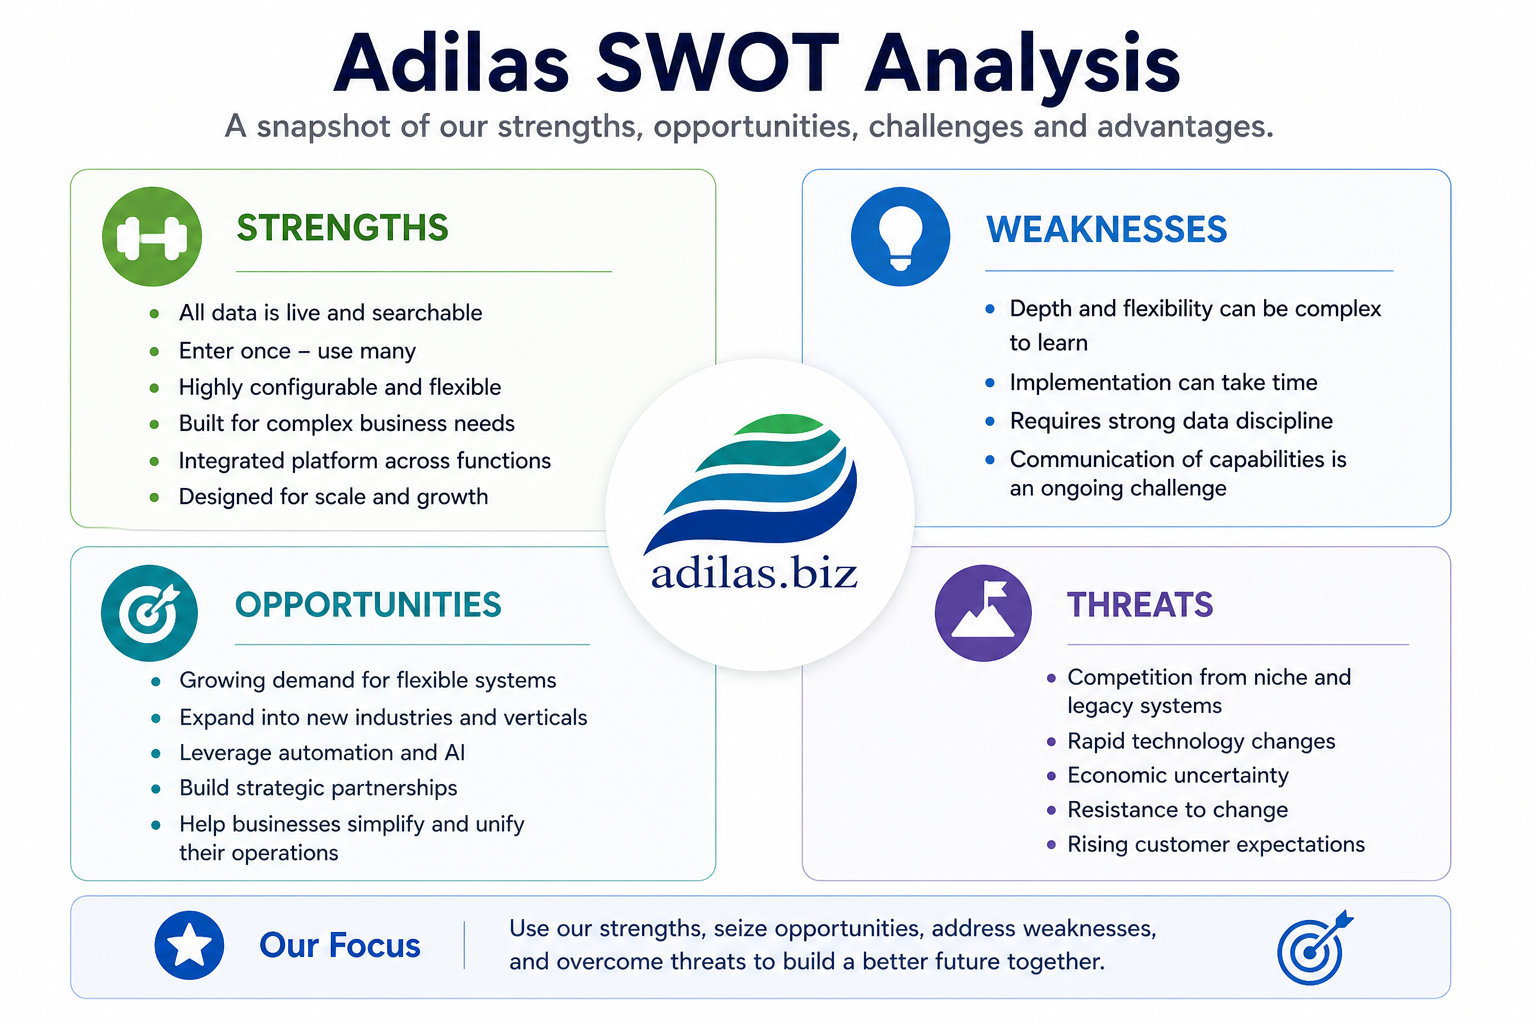

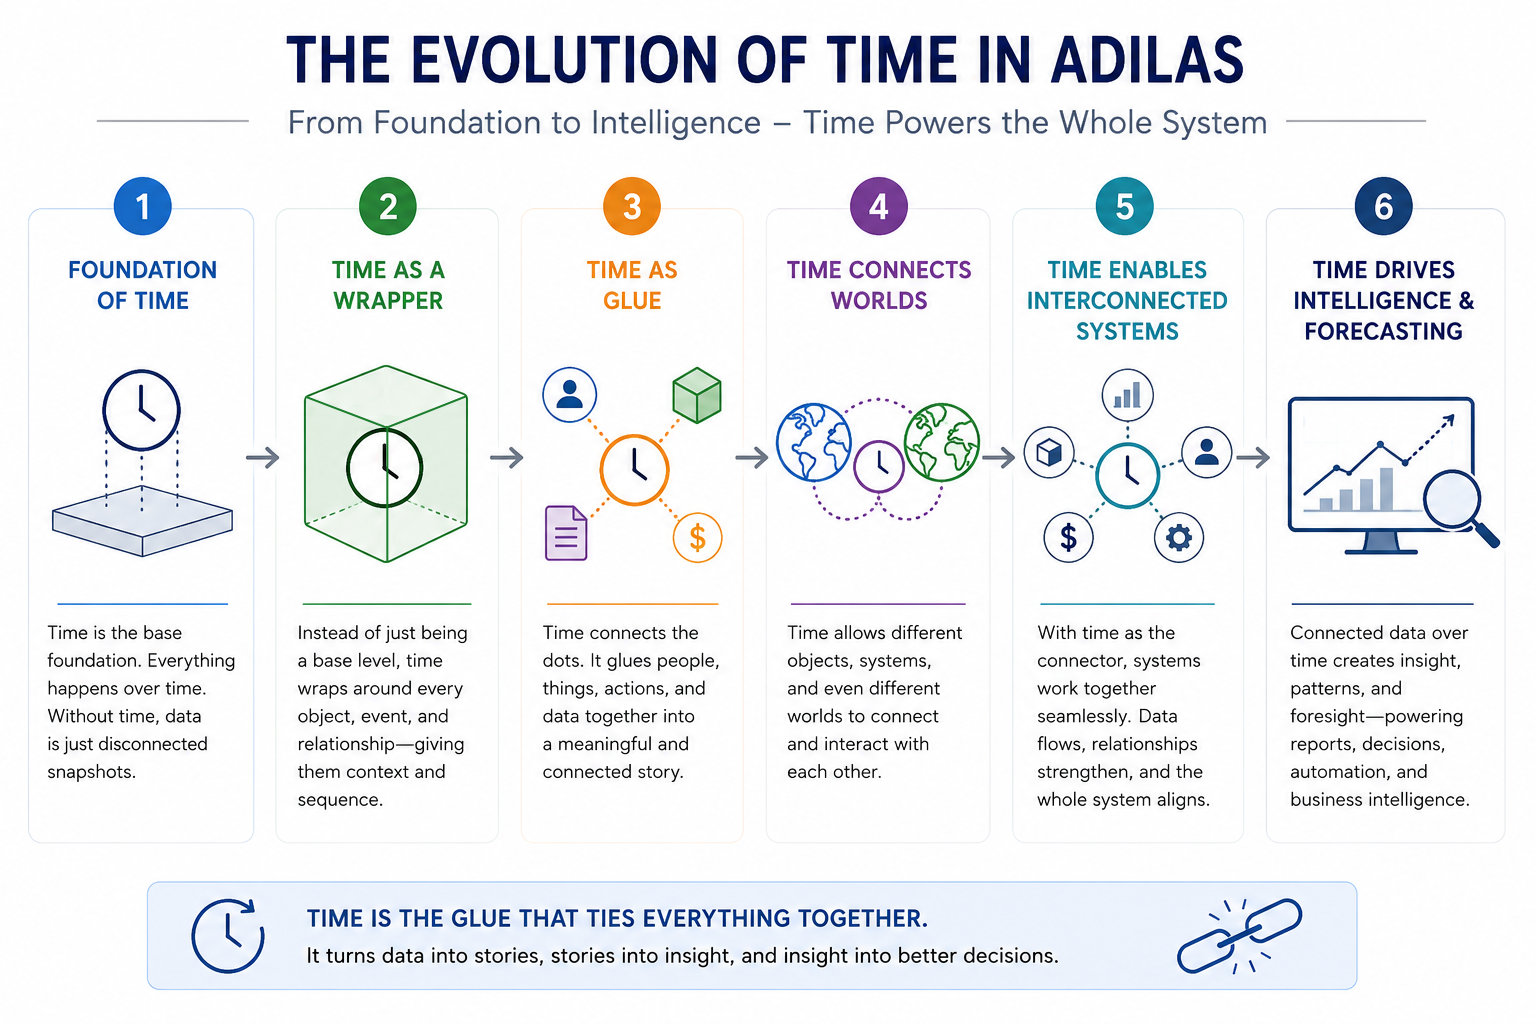
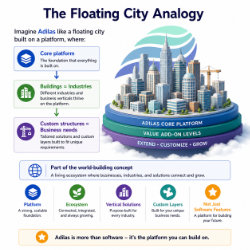
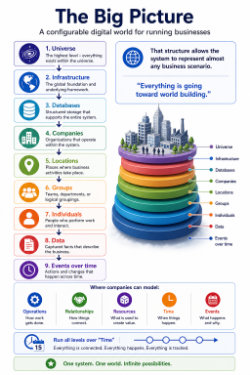
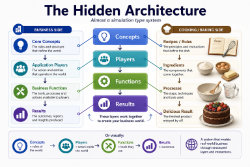
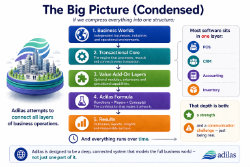
Flyers and infographics...
Simplfied Documents...
Topic Exploration & Deep Dives...