all data is live and searchable
« Back .
[Adilas youtube training videos] .
[Adilas steps to success - user guide (under construction)]
. [Adilas "quick search" help]
[Adilas university] . [all Adilas help files] . [developer's notebook] . [Adilas web/api documentation] . [contact Adilas support - email form]
[online glossary] . [presentation gallery - outline]
[Adilas university] . [all Adilas help files] . [developer's notebook] . [Adilas web/api documentation] . [contact Adilas support - email form]
[online glossary] . [presentation gallery - outline]
|
More info below the graphics... Click on the graphics to see more details.
|
||
|
|
|
|
3D Assembly Line For Data
|
|
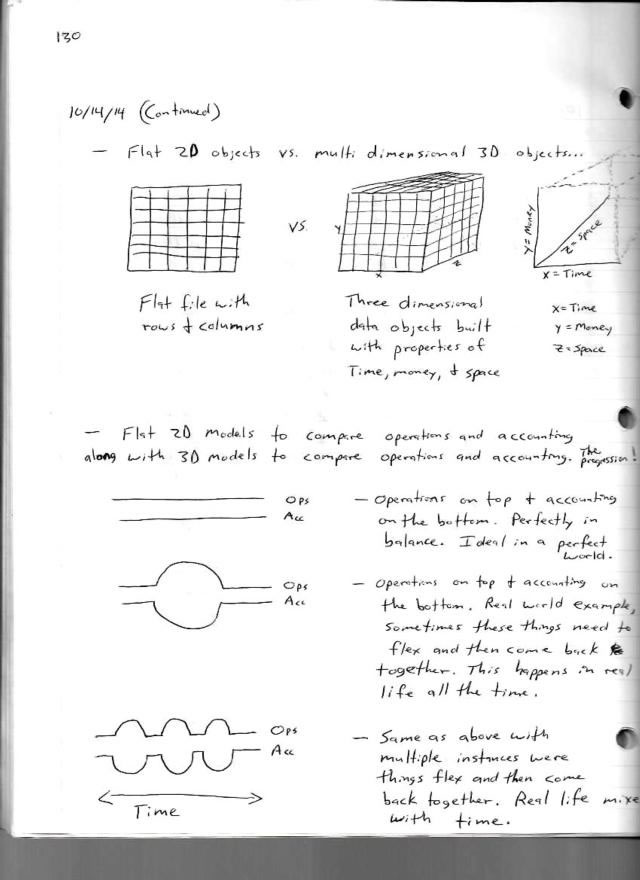
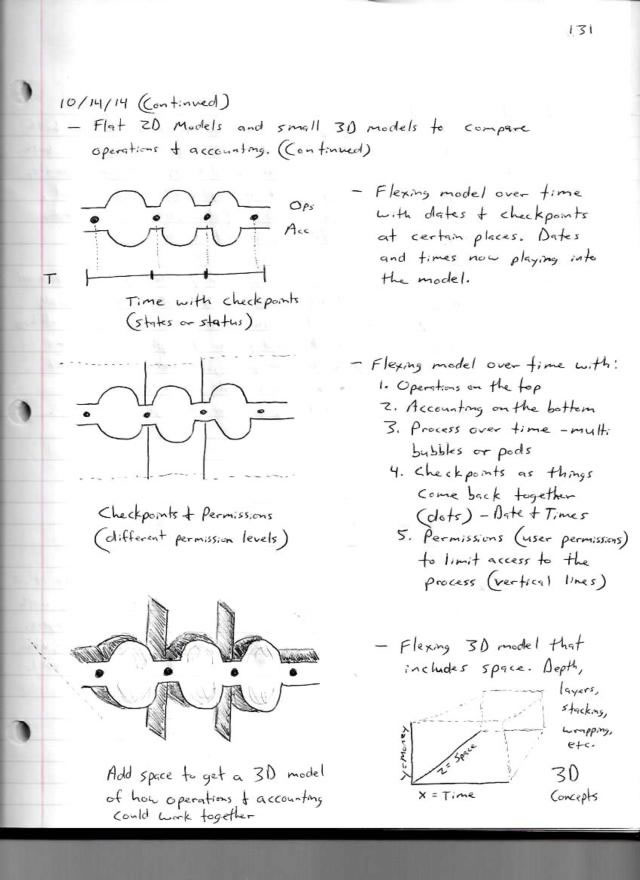
This help file covers the topic of what we call the data assembly line or 3D assembly line for data. The original concept was introduced by Steve Berkenkotter to Brandon Moore as part of a balance sheet project back in October of 2010. Brandon was struggling with the concept of keeping everything perfectly balanced for the balance sheet. Steve helped calm Brandon's anxiety down by explaining that the goal was to track each piece of the puzzle and then just show what that means or what state or status the transaction was in.
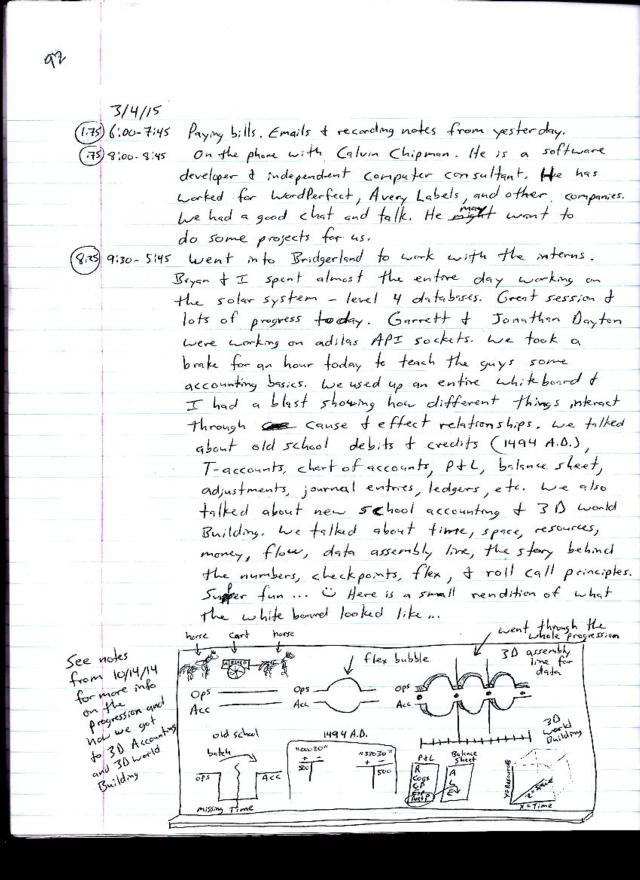
Instead of forcing a perfect balance, you virtually need to let it flex and flow and then come back together at a checkpoint or place in time. Anyways, over the years, our vision has expanded and we keep pushing the analogy further and further down the road. See below for some highlighted comments and notes that helped in the building of the data assembly line or the 3D assembly line for data. Entry from 12/4/10 - Notes from a presentation from Jim Phillips (Safe Harbor Aliance) - It is a "System" - key word. - Teach the "why" - counter to the fast food mentality - I want it now! - A full system allows you to do things that others can't do... - Technique and art of doing... - Why do you do it? Because it needs to be done! - Ask the question - what would I do? This helps to develop the why - the why takes time to figure out and develop. - Lab test between static vs. dynamic. Static - there may be other products that perform in this type of environment. Dynamic - real world is very dynamic. You have to plan for it. - Start from the bottom up! - Function vs. fashion - make a choice, this is an attitude. Does it work? Once you get it to work, you can make it look pretty. Pick your options. Entry from 8/2/13 - The assembly line really helped out businesses. Things were done overtime and then passed on to the next step of the assembly line. Adilas does the same exact thing with your business data. Things are done over time and then passed on to the next step. Pretty cool! - I'd like to make a graphic and show how businesses use different assembly lines. It would then be fun to show how Adilas uses similar processes to link and connect data together. - This is an old analogy we used to use for showing flow (graphics/sketches for each): operations and accounting - both perfectly in line - static. Operations and accounting - different things happen over time but they come back together - dynamic. The new analogy may look something like this - once again relating back to an assembly line - type analogy: operations and accounting - different things happen over time but they come back together in order to pass the checkpoints. Or another analogy that fits this flow is a bottle of data flowing down the river. As it flows (through a virtual assembly line) it passes certain checkpoints. My daughter even drew me a graphic for this. Some of the key elements are: 1. Enter once 2. Use over and over 3. Run it over time 4. Checkpoints help maintain flow 5. Checkpoints may be permissioned if needed 6. Track the entire life cycle. Entry from 10/16/13 - Run all levels over "time" - Create the business data assembly line with checkpoints and permissions. Entry from 10/24/13 - Think of Adilas like a game... cause & effect, cause & effect... - Henry Ford and the assembly line --- Adilas ---- Adilas - a new tradition. Entry from 11/7/13 - Went in to town for a 3D simulation demo of a program for assembly lines and robots. I was trying to get ideas on how to show data assembly and real-time cause and effect relationships. Tons of ideas. Entry from 3/6/14 This month Adilas started holding weekly demos called "Cloud Software Demo - Challenging and Breaking Traditions". A robotics teacher participated at one of these demos and helped contribute to a great discussion on how Adilas is an assembly line for business data and business processes. From this session, and realizing the customization potential and flexibility behind this full business system application, he helped express some ideas that have been adapted to become a new Adilas catch phrase, "Your data, your world, your way!". - The robotics teacher, during the demo, really caught on to the data and process assembly line concept. He loved the fact that one, it existed, and two, that is was customizable. He thought that we should focus more on that vs. permissions and settings which allow us to do that. In selling terms - you sell the "sizzle" not the "stake". I loved it! - Questions for people... Do you have any custom processes? What are your data points? How many places of entry do you have? Where is your pain? - We then come back and show how we can fill those needs. We have both custom and flexibility that are ready out of the box. - "This may be the only system that you need." - Robotics teacher. - "Your data, your system, your world, your way." Great little tag line for Adilas - the "any" thing software. Dream it up! We'll help you wire it up! - You control the process and your own virtual data assembly line. - There was a lot of focus on the words "you" and "your" and "yours". Kind of interesting. - At the end of the demo the teacher went back to check on his class. After a couple of minutes, he came back while we were taking things down. He basically said, "You need to start selling this thing! It is ready! Put a stamp on it! You're done!" This was dealing with me not letting it go because it isn't done yet. I know that I need to get out of the way and let people come in and use our product. I'm trying to get out of the way! I really am! - Adilas - the "anything" software! Entry from 3/8/14 - Recording notes in notebook, reviewing to do lists, and trying to get organized. Added a couple new graphics to the Adilas class and teaching photo gallery. Light research on robotic assembly lines. I want to draw a parallel between a robotic assembly line for actual products and an assembly line for business processes and business data. As a note, see elements of time inside Adilas university. Do a search for "robot" and then do another search for "assembly line". There are some good entries there. Entry from 9/6/14 - Thinking about the data and business assembly line concept. We've got to get that out there to the world. It deals with world building, automated pieces working together, and kind of like a robotic manufacturing facility - but for data and business logic vs. normal manufactured goods. The data assembly line for businesses. See notes back from 8/2/13. Also search Adilas university for notes regarding "assembly line". Lots of notes on the subject. This is the future of many businesses. It need to be protected as a general universal concept. We all need it! Entry from 10/15/14 - Recording notes and pushing up brainstorming docs to elements of time. - Drawing pictures comparing 2D and 3D objects in my notebook. This is basically the history of how our vision of the assembly line for data came about. Steve originally came up with the concept of the assembly line for data in 2008. As some of our meetings progressed, a number of questions came up about how to handle different scenarios. See elements of time in Adilas university from January 2008 to December 2008. Search for the words "balance sheet" between those dates. Around November of 2008 we were getting pretty deep. It was then that Steve had to help explain that our job was to just show the data back to the user vs. forcing a perfect balance. He drew the original analogy of... Operations & accounting: Ideal in a perfect world or controlled environment vs. Real world requires flex and possible variables (please see sketches on scans in photo galleries). Original model or analogy done by Steve in 2008. - As of now, 10/15/14, that model has grown and developed into a full 3D (three dimensional) model using time, money, and space (depth) to track user's actions and reactions. Basically a 3D cause and effect model. We call it an assembly line for data. See a couple pages back for a visual evolution of our model. - I couldn't help it... I was so excited about taking our data assembly line concept to 3D that I spent a couple of hours creating some Adilas.biz 3D world building graphics. - Adding new 3D world building graphics to a new 3D world building help file. See the following web address - https://data0.adilas.biz/top_secret/help.cfm?id=483&pwd=building Entry from 10/31/14 - Added 3D world building concepts to the banners. Purchased a couple new domain names for assembly line for data. - Finalized the new banners and put the high resolution PDF's online. I also added new elements of time with graphics and links to the new banners. The second banner has verbage and graphics dealing with 3D world building, assembly line for data, custom data engine, and real-time data portal. See elements of time #2788 in Adilas university site or #901 in the main Adilas site. Trying to start recording as we go vs. waiting until the end. Entry from 1/10/15 - Think of a team scenario... break projects down into the main components. Number the pieces, determine the levels, make assignments and plan accordingly. Almost like an assembly line for projects. Plan, prep, build, sign-off. Entry from 3/4/15 - We took a break for an hour today to teach the guys some accounting basics. We used up an entire whiteboard and I had a blast showing how different things interact through cause and effect relationships. We talked about old school debits and credits (1494 A.D.), T-accounts, chart of accounts, P&L, balance sheet, adjustments, journal entries, ledgers, etc. We also talked about new school accounting, and 3D World Building. We talked about time, space, resources, money, flow, data assembly line, the story behind the numbers, checkpoints, flex, and roll call principles. Super fun... : ) Here is a small rendition of what the white board looked like... - See notes from 10/14/14 for more info on the progression and how we got to 3D Accounting and 3D World Building. Went through the whole progression: (Please see sketch on scan in photo gallery): (Includes: horse, cart & horse, Operations & Accounting flex bubble, Old school accounting and operations batching missing time (gap of time), T-accounts, 3D assembly line for data, 3D World Building (x = time, y = resources, z = space). - I had a lot of fun today talking about the progression of accounting... We went from debits and credits to cause and effect relationships as they flow and pass through space and time. Sort of an overview of old school accounting vs. new school accounting. See small drawing on other page. Fun little session. At the end of the teaching session... an intern wanted to see that - the progression and data assembly line for data - in real life - inside of Adilas. We did some sales, deposits, and ran P&L and balance sheets to show what was going on. Good stuff! - I enjoy learning how things work. It has been super fun to learn things along the way. Entry from 3/10/15 - Working with my brother on graphics and ideas for showing developers tools and functions. We looked at his pages and graphics and sketched out ideas. We also went through the progression of the data assembly line. Lots of sketches and drawings. We also talked about how our vision has grown over the years. Entry from 3/31/15 - I had a great meeting with a local consultant and his partner. We chatted for a bit and then moved over to the whiteboard. We talked about systemizing things, data assembly line, and 3D World Building. Great meeting. They scheduled another meeting for next Tuesday to see a demo. |
| This YouTube video was shot in February 2013 as part of an Adilas.biz training class. It is 18 minutes long and covers a number of core Adilas concepts. If you watch the last three minutes, it goes over the concept of the data assembly line as we knew it at that point (15:00 to 18:00 - watch the last 3 minutes). |